Roche Diagnostics
Instructions for Use · Version 13.0 177
cobas b 123 POC system 6 Measurement
Patient trend diagrams
Patient trend diagrams
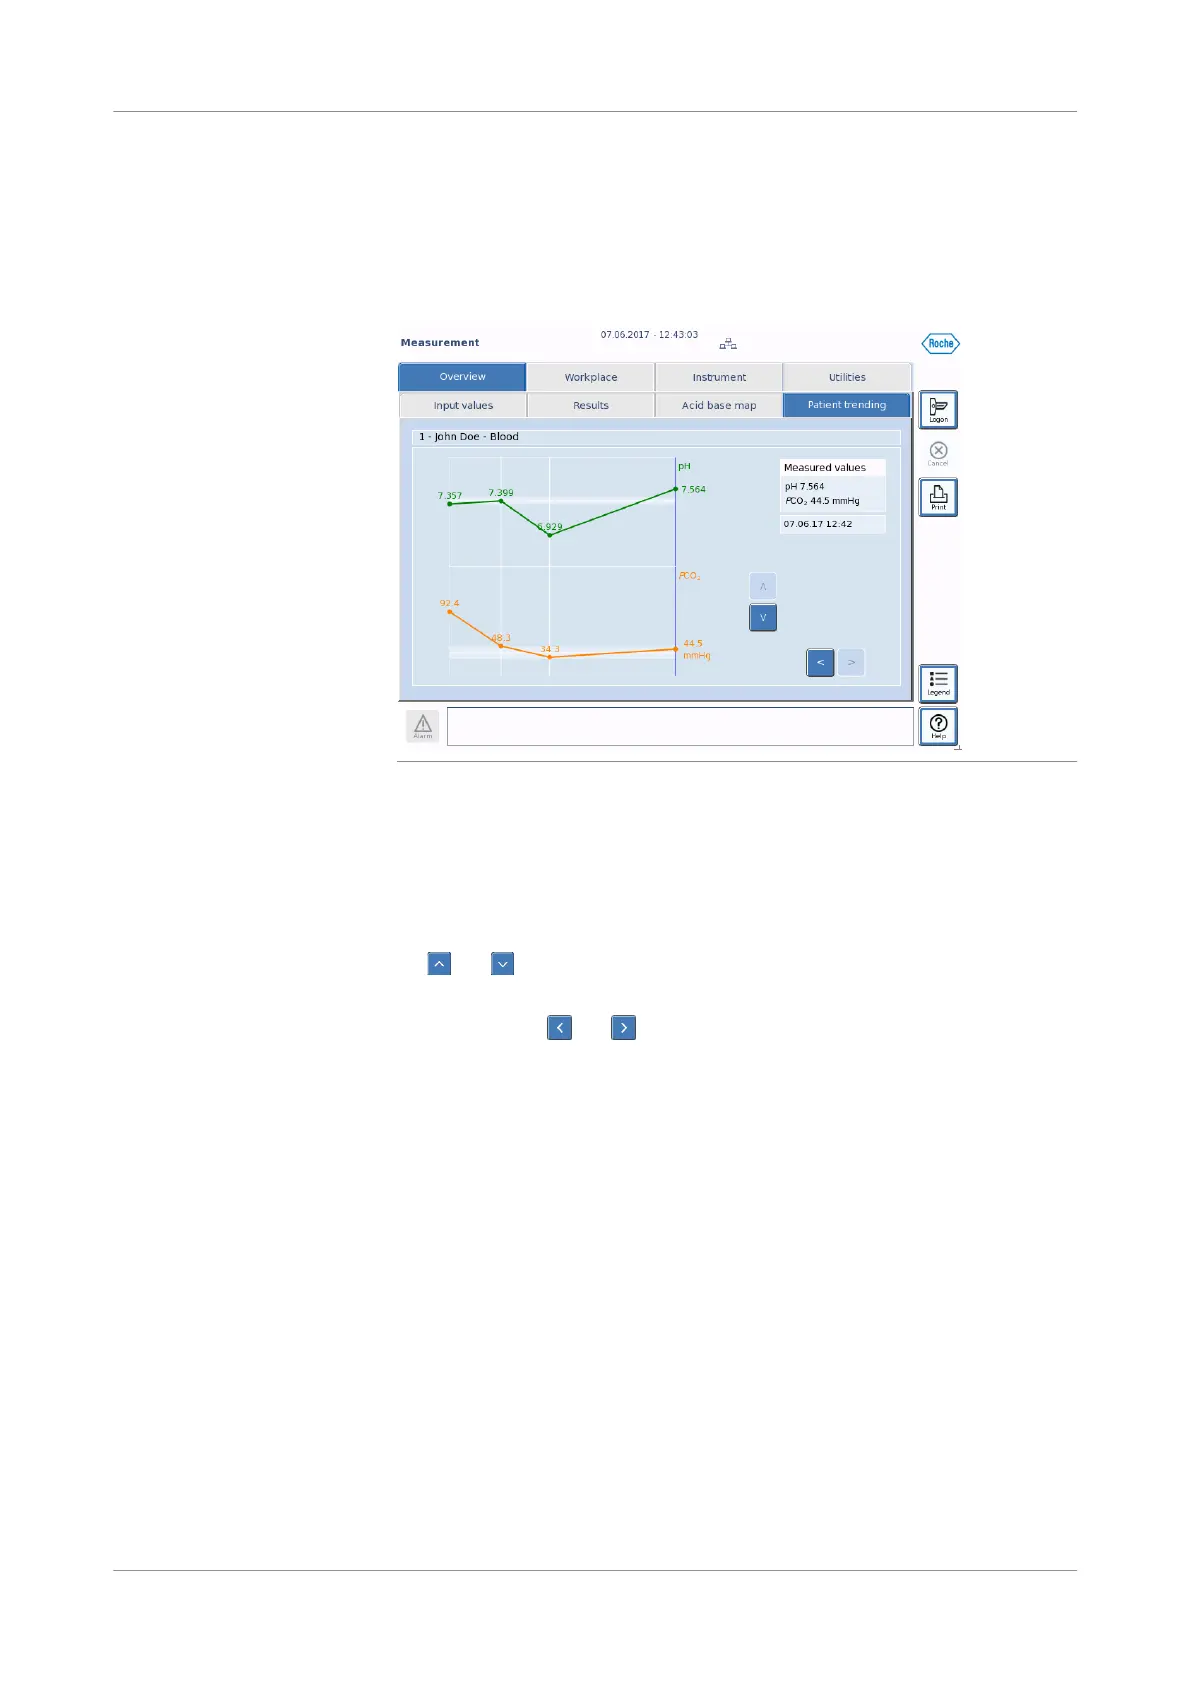
You can monitor all measured parameters for up to 10 days for a patient using
patient trend diagrams. You can only view up to 2 parameters on the same diagram.
Figure 6-29 Patient trend diagram
If all measured values are available, all mandatory inputs have been entered and you
have 2 or more measurements available from the same patient within the last 10 days,
you can view patient trending diagrams in the Patient trending tab.
In addition, you can view patient trending diagrams in the measuring database.
To change which parameters are shown in the patient trending diagram, press
the and buttons.
To view the measured values for a specific measurement on the patient trending
diagram, press the and buttons.
To change the time range of the diagram or the number of measurements shown on
the diagram, press the Change selection button. This is only available when viewing
the patient trend diagram from the measuring database.
 Loading...