Roche Diagnostics
Instructions for Use · Version 13.0 193
cobas b 123 POC system 7 Quality control
Levey-Jennings graphs
Levey-Jennings graphs
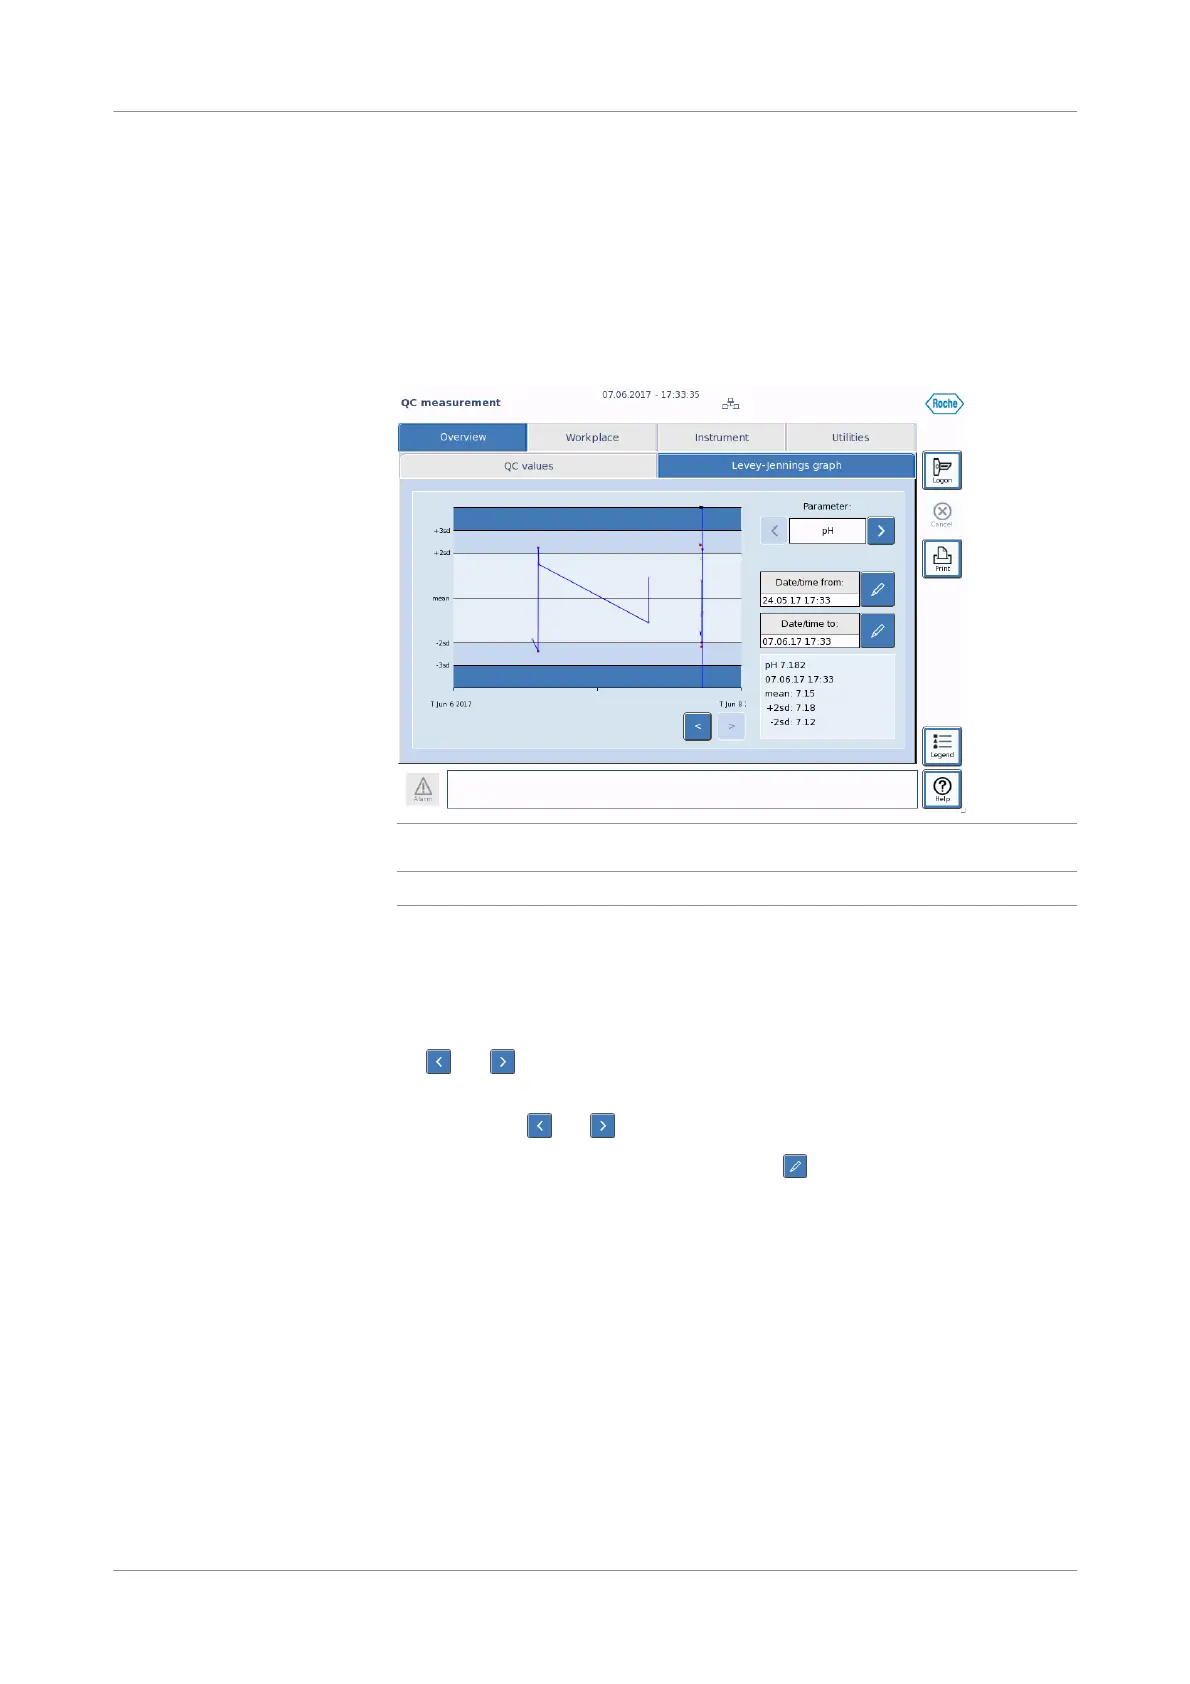
Levey-Jennings graphs show the progress of QC measurement results, in order to
help you find errors in how the system measures.
These graphs are created for each parameter using QC measurement results
performed on the same QC material and level.
Figure 7-17 Levey-Jennings graph
q
Levey-Jennings graphs are not available for proficiency test measurements.
If you have performed at least 1 other QC measurement with the same QC material
and level, you can view these graphs in the Levey-Jennings graph tab.
In addition, you can view Levey-Jennings graphs in the QC database.
To change which parameters are shown in the Levey-Jennings graph, press
the and buttons on the Parameter field.
To view the measured values for a specific QC measurement on the Levey-Jennings
graph, press the and buttons.
To change the time range of the graph, press the buttons on the Date/time from
and Date/time to: fields. Enter your desired date and time using the schedule dialog
box that appears on the screen.
 Loading...