6.2
SEL-734 Meter Instruction Manual Date Code 20090730
Power Quality and Event Analysis
Event Reports
Voltage Sag/Swell/
Interruption (VSSI)
Report
The VSSI report captures voltage disturbances and displays summary or
detailed information per IEC 61000-4-30 and CBEMA/ITIC. The SEL-734
reports VSSI disturbances through the SER, SEL ASCII,
ACSELERATOR
QuickSet and DNP3 interfaces. The
ACSELERATOR QuickSet
®
SEL-5030
Software interface includes graphical representation of disturbances with
additional analysis options.
Event Reports
Standard Event
Report Triggering
The meter triggers (generates) a standard event report when any of the
following occur:
➤ Programmable SELOGIC
®
control equation settings ERn
(n = 1–3) asserts to logical 1
➤ TRI (Trigger Event Reports) serial port command executed
Programmable SELOGIC Control Equation Settings ERn
The programmable SELOGIC control equation event report trigger settings
ER1, ER2, and ER3 are set to trigger standard event reports. When setting
ERn sees a logical 0 to logical 1 transition, it generates an event report (if the
SEL-734 is not already generating a report that encompasses the new
transition). The factory setting for SEL-734 meters is listed below:
ERn = 0
TRI (Trigger Event Report)
The sole function of the TRI serial port command is to generate standard
event reports, primarily for testing purposes.
See Section 10: Communications and Section 11: Front-Panel Operation for
more information on the TRI (Trigger Event Report) and PUL (Pulse Output
Contact) commands.
Standard Event
Report Summary
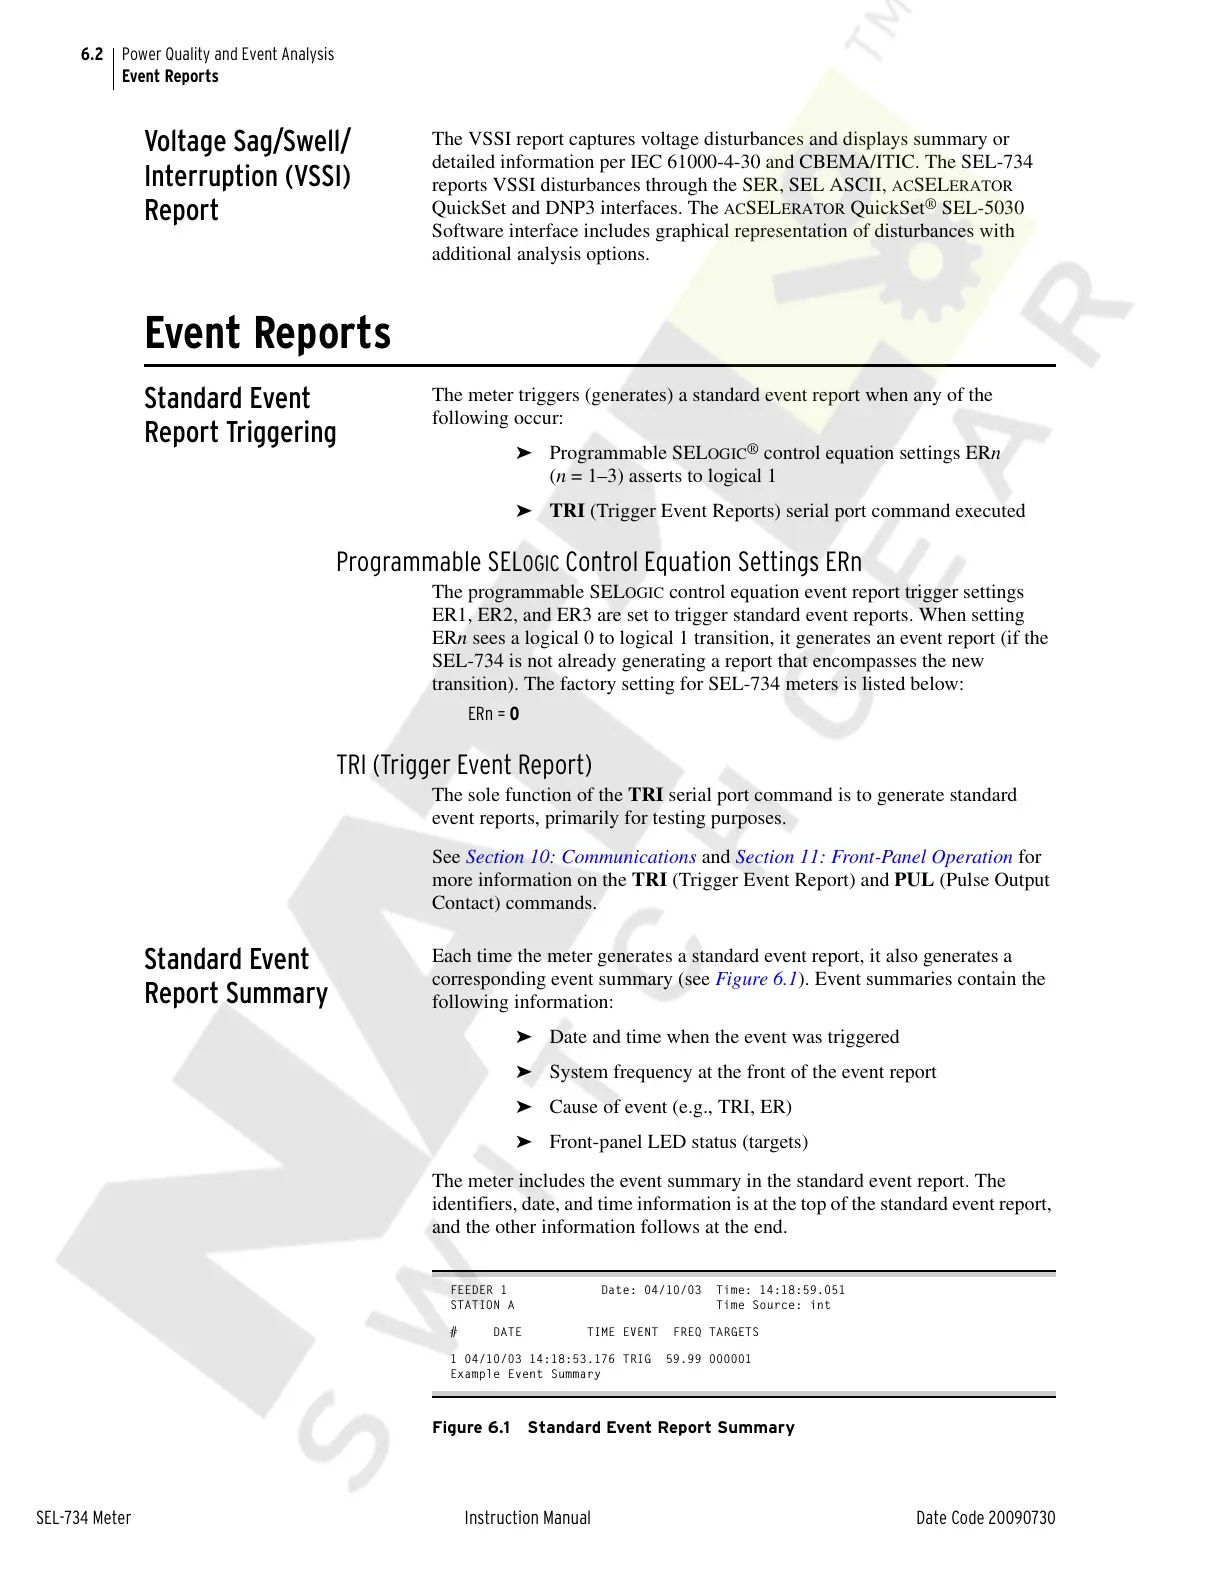
Each time the meter generates a standard event report, it also generates a
corresponding event summary (see Figure 6.1). Event summaries contain the
following information:
➤ Date and time when the event was triggered
➤ System frequency at the front of the event report
➤ Cause of event (e.g., TRI, ER)
➤ Front-panel LED status (targets)
The meter includes the event summary in the standard event report. The
identifiers, date, and time information is at the top of the standard event report,
and the other information follows at the end.
FEEDER 1 Date: 04/10/03 Time: 14:18:59.051
STATION A Time Source: int
# DATE TIME EVENT FREQ TARGETS
1 04/10/03 14:18:53.176 TRIG 59.99 000001
Example Event Summary
Figure 6.1 Standard Event Report Summary
Courtesy of NationalSwitchgear.com