6.13
Date Code 20090730 Instruction Manual SEL-734 Meter
Power Quality and Event Analysis
Sag/Swell/Interruption (SSI) Report
➤ State of the Sag/Swell/Interruption Meter Word bits, by phase
➤ Trigger status
➤ Recorder status
NOTE: Any current or voltage value
greater than 999 percent will be
replaced by “$$$” in the SSI report.
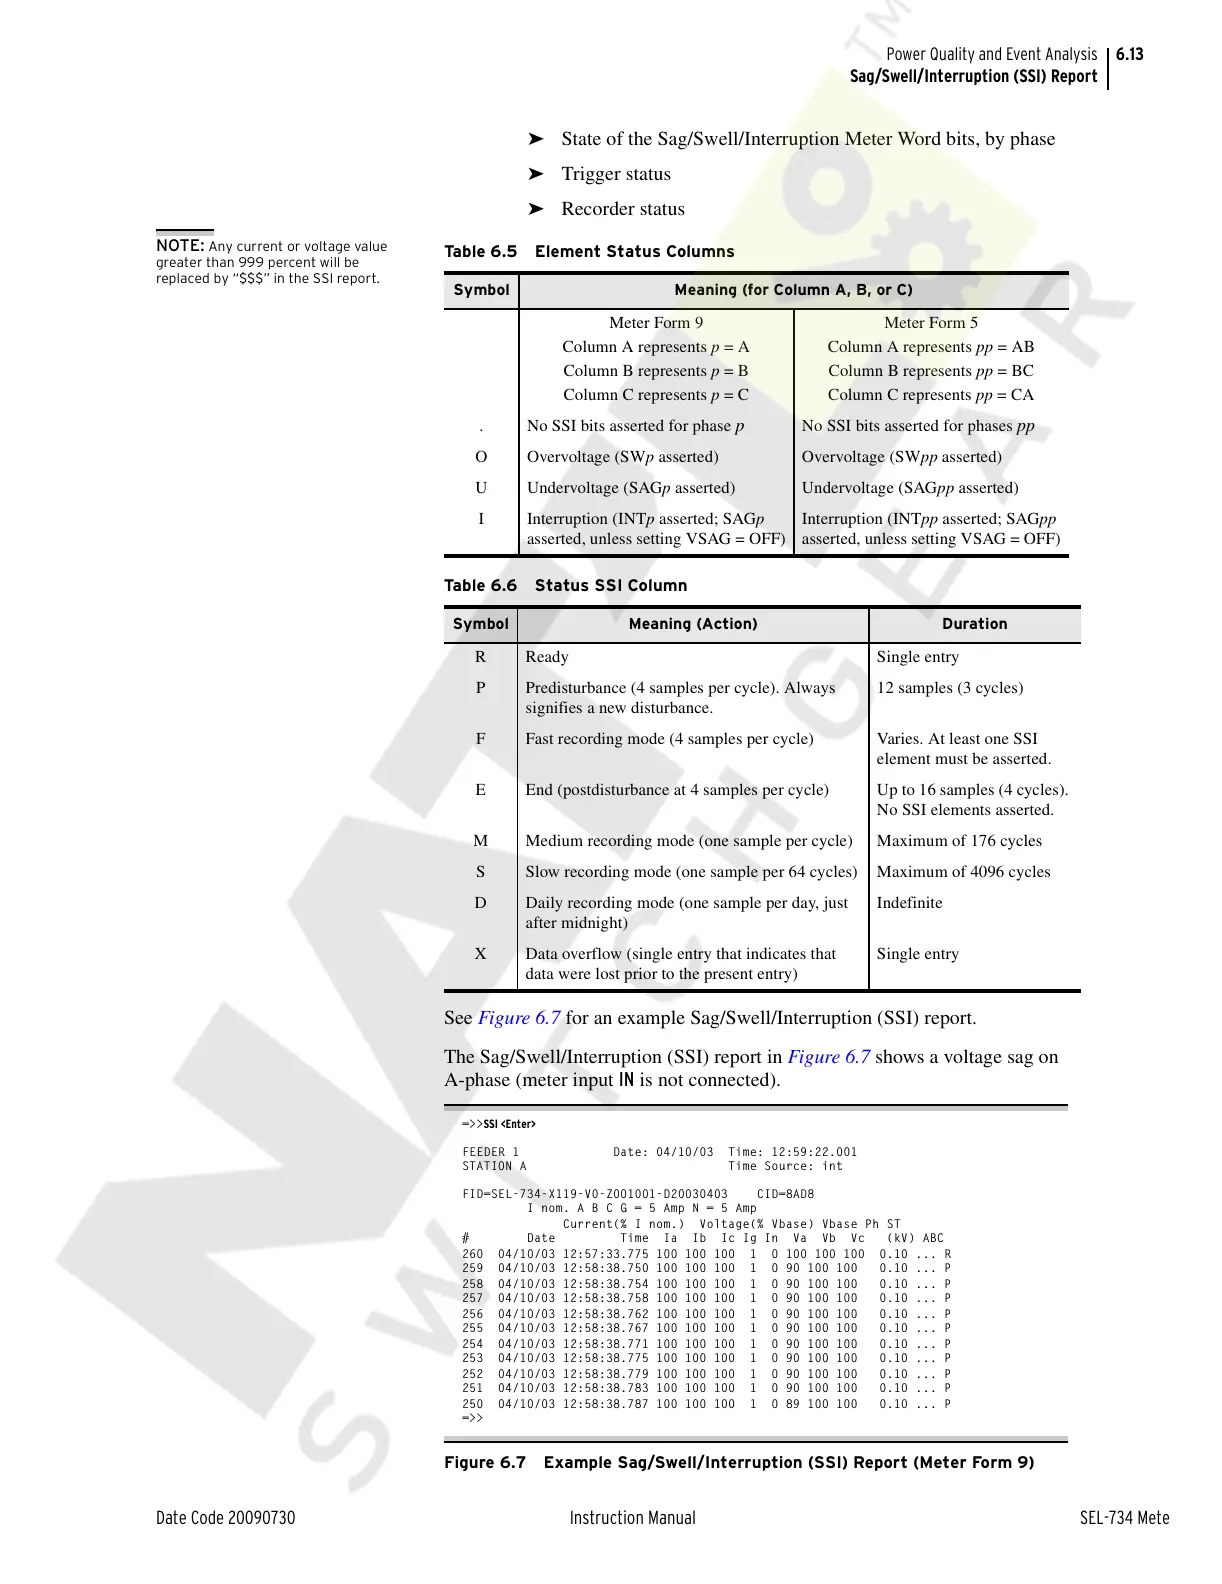
See Figure 6.7 for an example Sag/Swell/Interruption (SSI) report.
The Sag/Swell/Interruption (SSI) report in Figure 6.7 shows a voltage sag on
A-phase (meter input IN is not connected).
=>>SSI <Enter>
FEEDER 1 Date: 04/10/03 Time: 12:59:22.001
STATION A Time Source: int
FID=SEL-734-X119-V0-Z001001-D20030403 CID=8AD8
I nom. A B C G = 5 Amp N = 5 Amp
Current(% I nom.) Voltage(% Vbase) Vbase Ph ST
# Date Time Ia Ib Ic Ig In Va Vb Vc (kV) ABC
260 04/10/03 12:57:33.775 100 100 100 1 0 100 100 100 0.10 ... R
259 04/10/03 12:58:38.750 100 100 100 1 0 90 100 100 0.10 ... P
258 04/10/03 12:58:38.754 100 100 100 1 0 90 100 100 0.10 ... P
257 04/10/03 12:58:38.758 100 100 100 1 0 90 100 100 0.10 ... P
256 04/10/03 12:58:38.762 100 100 100 1 0 90 100 100 0.10 ... P
255 04/10/03 12:58:38.767 100 100 100 1 0 90 100 100 0.10 ... P
254 04/10/03 12:58:38.771 100 100 100 1 0 90 100 100 0.10 ... P
253 04/10/03 12:58:38.775 100 100 100 1 0 90 100 100 0.10 ... P
252 04/10/03 12:58:38.779 100 100 100 1 0 90 100 100 0.10 ... P
251 04/10/03 12:58:38.783 100 100 100 1 0 90 100 100 0.10 ... P
250 04/10/03 12:58:38.787 100 100 100 1 0 89 100 100 0.10 ... P
=>>
Figure 6.7 Example Sag/Swell/Interruption (SSI) Report (Meter Form 9)
Table 6.5 Element Status Columns
Symbol Meaning (for Column A, B, or C)
Meter Form 9
Column A represents p = A
Column B represents p = B
Column C represents p = C
Meter Form 5
Column A represents pp = AB
Column B represents pp = BC
Column C represents pp = CA
. No SSI bits asserted for phase
p No SSI bits asserted for phases pp
O Overvoltage (SWp asserted) Overvoltage (SWpp asserted)
U Undervoltage (SAGp asserted) Undervoltage (SAGpp asserted)
I Interruption (INTp asserted; SAGp
asserted, unless setting VSAG = OFF)
Interruption (INTpp asserted; SAGpp
asserted, unless setting VSAG = OFF)
Table 6.6 Status SSI Column
Symbol Meaning (Action) Duration
R Ready Single entry
P Predisturbance (4 samples per cycle). Always
signifies a new disturbance.
12 samples (3 cycles)
F Fast recording mode (4 samples per cycle) Varies. At least one SSI
element must be asserted.
E End (postdisturbance at 4 samples per cycle) Up to 16 samples (4 cycles).
No SSI elements asserted.
M Medium recording mode (one sample per cycle) Maximum of 176 cycles
S Slow recording mode (one sample per 64 cycles) Maximum of 4096 cycles
D Daily recording mode (one sample per day, just
after midnight)
Indefinite
X Data overflow (single entry that indicates that
data were lost prior to the present entry)
Single entry
Courtesy of NationalSwitchgear.com