10
03/2006
10.7 Trace function
10-202
© Siemens AG 2006 All Rights Reserved
SINUMERIK 840D/810D Start-Up Guide (IADC) – 03/2006 Edition
10.7.3 Display function
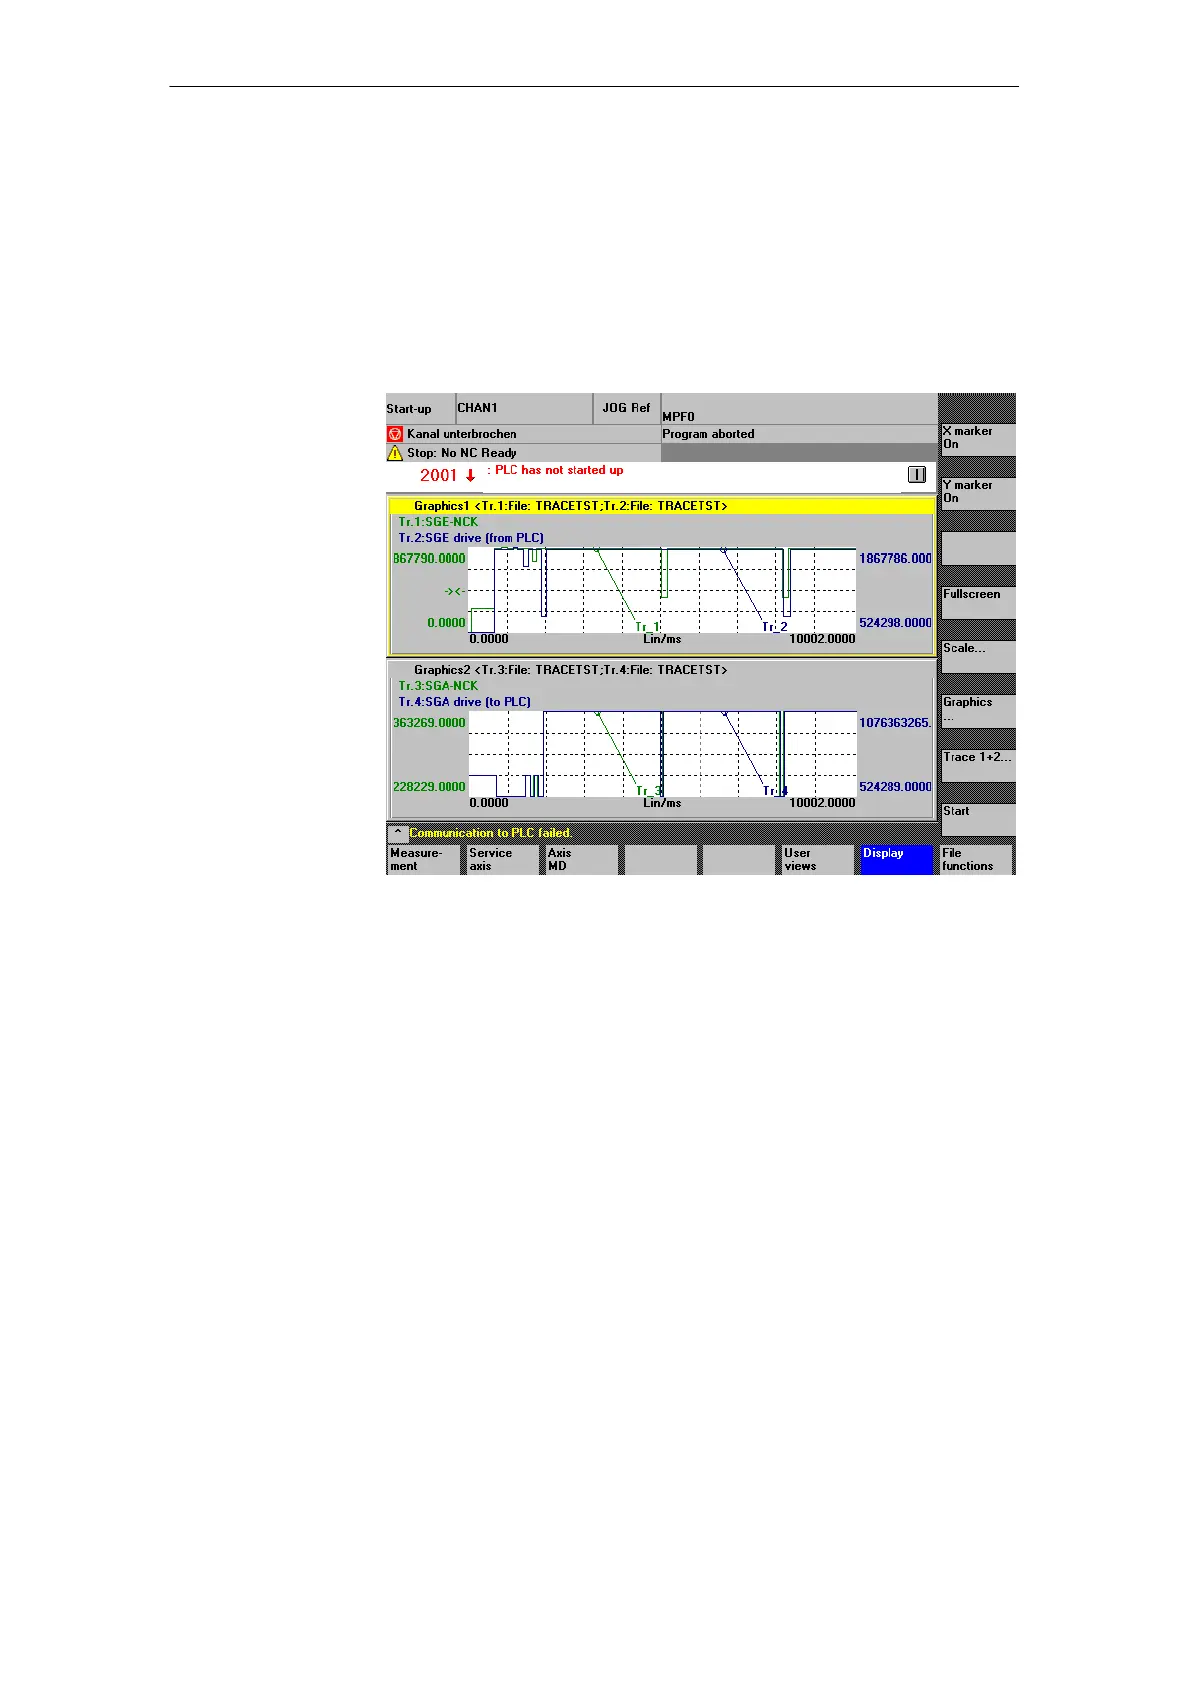
When the measurement is complete, the result can be displayed in a graph.
The horizontal soft key Display calls up the screen (Fig. 10-11).
The measured traces are shown as diagrams.
Graph1 shows trace 1 green and trace 2 (blue), while graph2 contains trace 3
green and trace 4 (blue).
Fig. 10-11 Graph1 and graph2 each shown with 2 traces
The X/Y markers are activated or deactivated in the active graph. The corre-
sponding position value is shown in the graph. The markers are moved by
means of the cursor keys.
After the zoom function has been used (see below), this soft key returns to the
original display as shown in Fig. 10-11.
When you press the soft key, Fig. 10-12, Y axis scaling, appears. You can scale
the traces in this window.
X marker and
Y marker soft keys
Full screen
soft key
Soft key Scale...
10 Drive O
timization
 Loading...