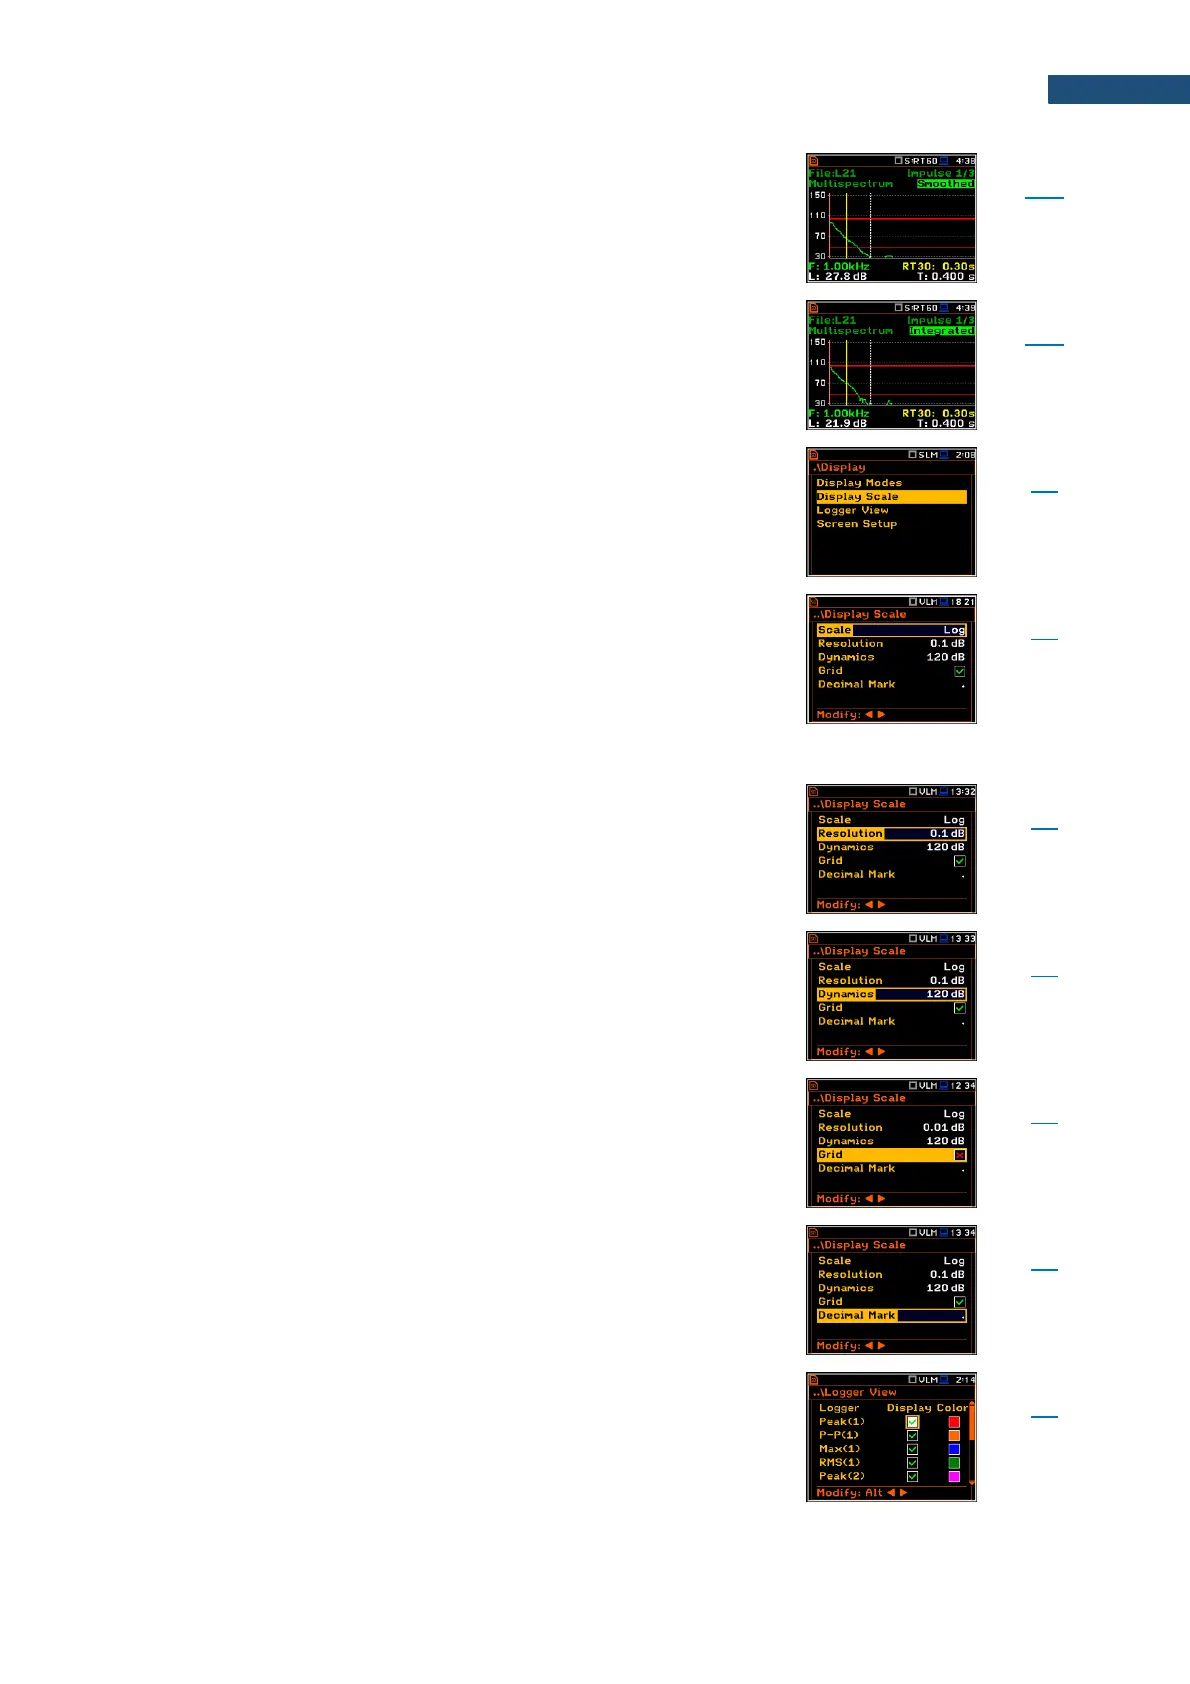
Presentation of smoothed decay curve of Leq results for
1/1 or 1/3-octave bands.
Presentation of the integrated raw decay curve
(Schroeder curve).
Screen that enables setting parameters of results
presentation: Scale, Resolution, Dynamics, Grid and
Decimal Mark.
Scale and units of results presentation: linear (Lin) or
logarithmic (Log). In case of Lin, results are presented in
absolute units and the Y-scale of the time history or
spectrum plot is linear. In case of Log, results are
presented in logarithmic units (dB) and the Y-scale of the
time history or spectrum plot is logarithmic. Sound
measurement results are presented always in
logarithmic units (dB).
Number of digits after the decimal point of the results
presentation: one digit after the decimal point (0.1 dB) or
two digits after the decimal point (0.01 dB).
Range of the plot scale: 10dB, 20dB, 40dB, 80dB, 100dB
and 120dB.
Grid swither on or off during the time history or spectrum
presentation.
Parameter that defines which decimal mark (point or
comma) will be used for data presentation in all
presentation modes.
Screen that enables selecting of time-history results,
which will be presented on the display and colours of
their plots.