88 | PGC5000 GEN 2 | 892 J006 MNAH
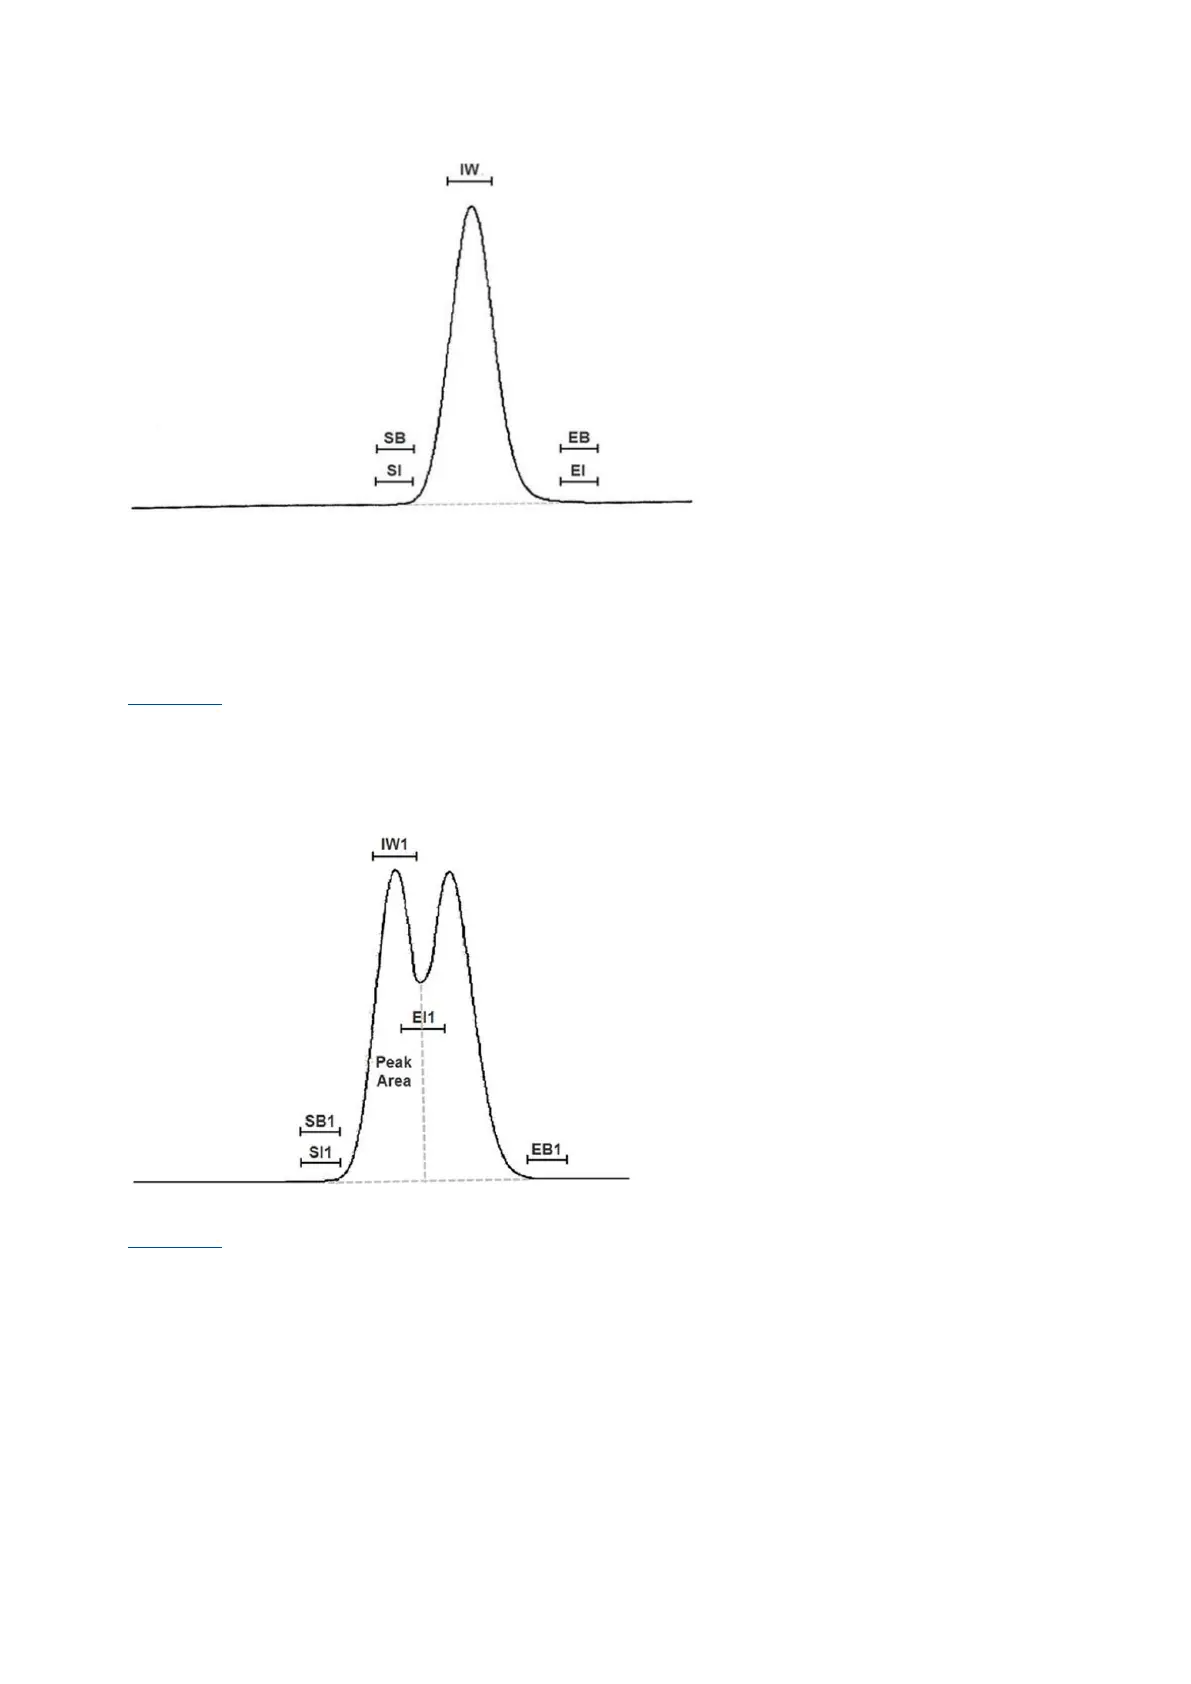
Figure 5-3: Min-max, single peak
The min-max method works strictly on finding minimums and maximums. The Identification Window
(IW) area defines the maximum point within the window and the time becomes the crest. The shape
of the chromatogram inside the IW is not considered. If the chromatogram shows multiple peaks
within the IW, the maximum peak is the crest and only one crest can be determined. The Start of
Baseline (SB), End of Baseline (EB), Start of Integration (SI) and End of Integration (EI) areas define
the minimum point within the window. The SI and EI determine the beginning and end of peak area
integration, while SB and EB determine the beginning and end of baseline correction.
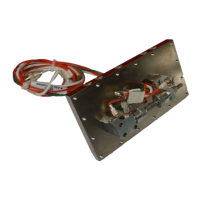
Figure 5-4 is an example of the integration and the baseline correction windows for a peak doublet
with a valley between, where only one of the peaks is integrated. The SI and the SB were identical,
but the EI and the EB are different. The second peak is not required for the baseline correction of the
first peak. In the min-max method, each peak is fully defined, and so is not dependent on any other
peak in the analysis.
Figure 5-4: Min-max, multiple peaks
Figure 5-5 defines the integration of two separate peaks and the windows for each peak separately.