7.1 Basic / Load Sections 7 ADDITIONAL ITEMS: BEYOND BASIC FUEL AND IGNITION CONTROL
7.1.11.2 ITB load TPS switch point curve This curve defines the TPS value where the MAP load reaches
%Baro switchpoint. This curve will be different for each engine and should be set up using values obtained from
log files from your engine. The curve tends to be fairly linear so you only need a few data points to plot the curve.
A data point at low, medium, and high RPM from a log file is usually enough. A spreadsheet or just graph paper
can then be used to establish enough data points to fill in the table for this curve.
ITB Load tuning requires that the MAP signal be above the %Baro switchpoint and that the TPS value be above
the value defined on this curve to switch from Speed-Density tuning to Alpha-N tuning. Therefore, you want this
curve to be relatively accurate and you may even want to set the values on the curve a few percent low to ensure
that the TPS value has been met when the MAP reaches the %Baro switchpoint.
Besides defining the switch point to Alpha-N tuning, this curve also establishes the lower TPS value that will be
used to interpret the range of VE bins allocated to Alpha-N tuning in the VE table.
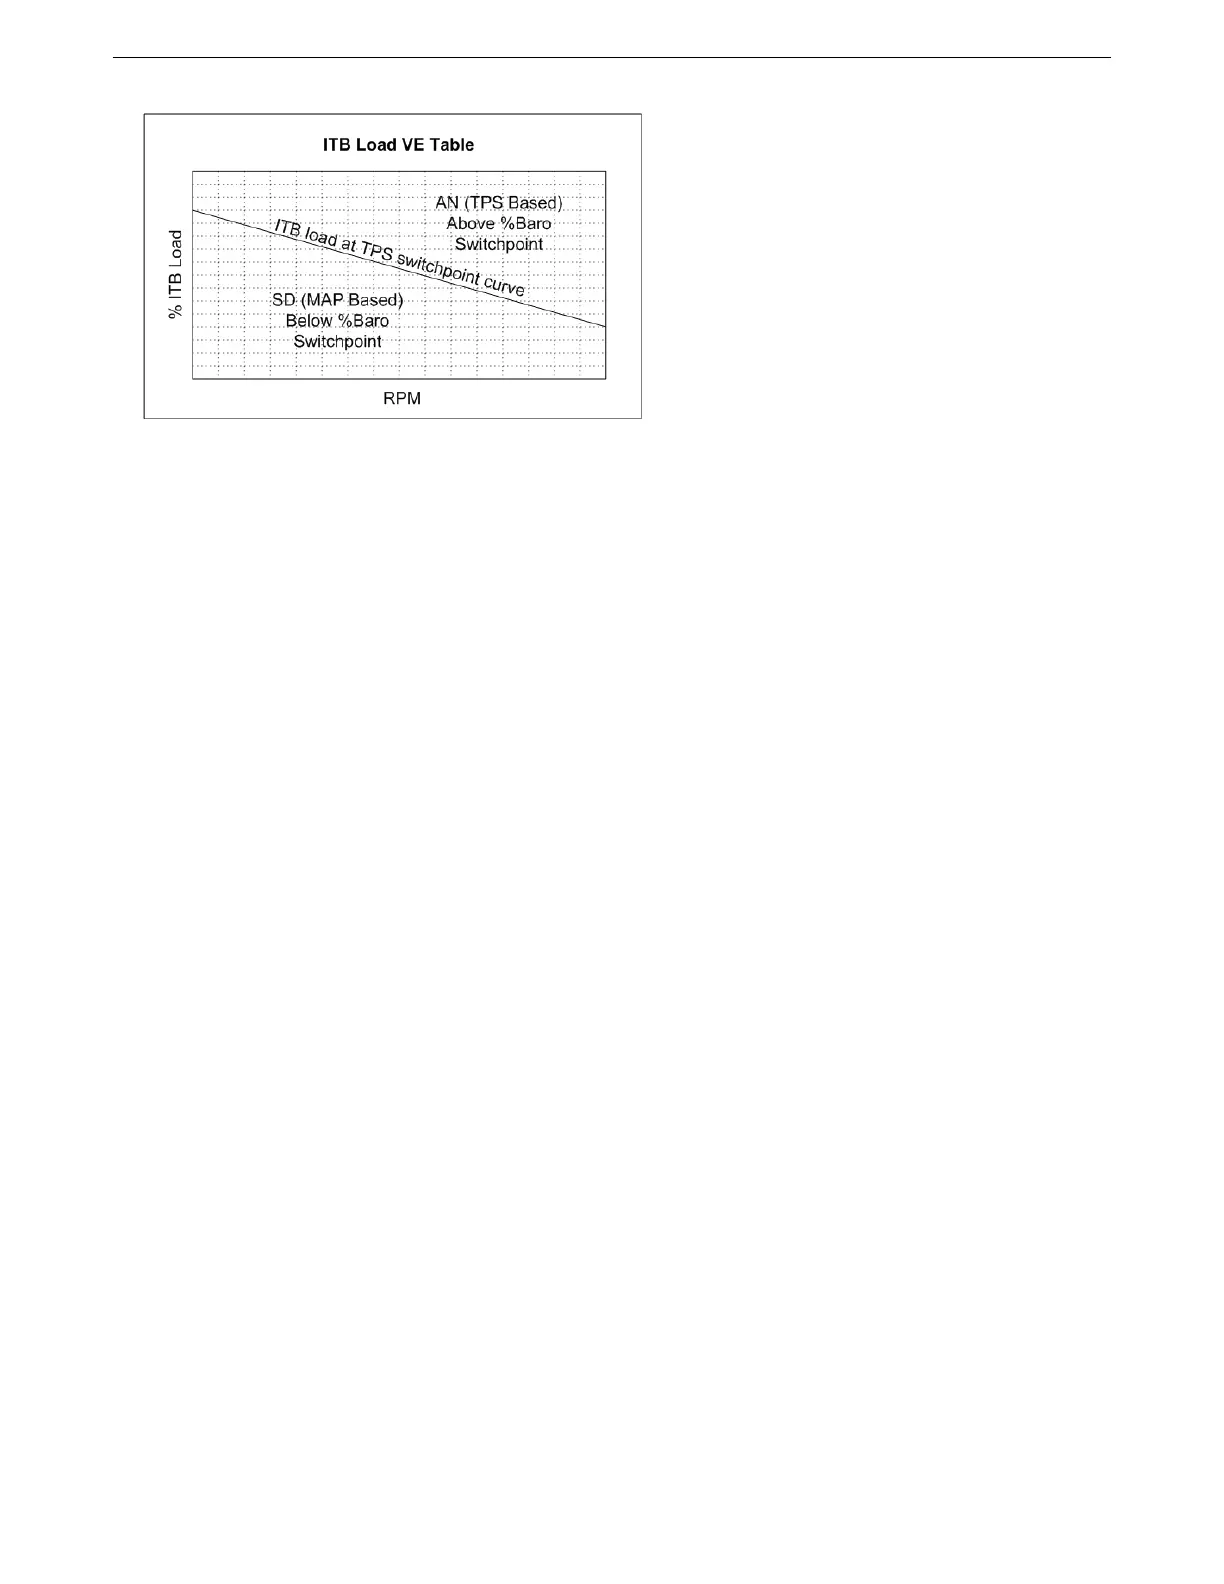
7.1.11.3 ITB Load at TPS Switchpoint Curve This curve is used to allocate the bins on the VE table to either
Speed-Density or Alpha-N tuning. The area of the VE table below the curve will be used for Speed-Density tuning
and the area above the curve will be used for Alpha-N tuning. The shape of this curve defines how much of the
VE table will be allocated for use between Speed-Density and Alpha-N tuning for each RPM column. You want to
allocate the largest portion of the VE table at each RPM to the tuning mode that has the most non-linear response.
The lower RPM region typically requires a little more Speed-Density definition range than the upper RPMs.
7.1.11.4 Putting it all Together - Calculating ITB Load The ITB Load VE table is defined as ITB Load vs.
RPM. The ITB Load should not be confused with MAP or TPS; it is neither. What the ITB Load tuning algorithm
does is calculate a load value based on MAP, TPS, and the two ITB Load curves. This calculated load value is the
Y axis of the ITB Load VE table; it can also be applied to the ignition advance and AFR tables as well.
7.1.11.5 ITB Load Calculation in Speed-Density Mode When the throttle position is less than the value de-
fined in the ITB load TPS switchpoint curve or the MAP value is less than the %Baro switchpoint, the tuning
algorithm will take the array of cells from the VE table below the ITB load at TPS switchpoint curve and interpret
this array within the context of 0% to %Baro switchpoint load.
A couple examples that assume %Baro switchpoint = 90:
If you have allocated the region between 0% ITB Load and 60% ITB Load on your VE table for use in Speed-
Density tuning and your %baro is 50% then the VE value for 30% ITB load will be used. In this same example, a
MAP value of 0kpa would use the 0% ITB load bin and a MAP value of just less than %Baro switchpoint would use
the VE value just below the 60% ITB Load value on the VE table.
AMP EFI MS3Pro manual version 1.202, firmware 1.5.0, 4/21/2017 Page 143