Time Domain, Option 2 8-3 VNA Master Implementation
Vector Network Analyzer MG PN: 10580-00289 Rev. K 8-3
Take a look at what happens in the distance domain for the same cable. As a user, you want
the reflection and transmission measurements to show you where the end of the cable is
located. Figure 8-2 shows a measured distance domain response of this cable for both
reflection (S
11
) and transmission (S
21
). The top trace is the S
11
plot showing the reflections
from both ends of the cable (MK1 at the near end, and MK2 at the far end). The bottom trace
shows the transmission S
21
measurement with the peak representing the signal received at
the end of the cable (MK3). Looking at the signal at MK2 and MK3, you can see that the
reflection and transmission measurements produced the same result for the length of the
cable. The VNA Master compensated for the round-trip condition in the S
11
measurement so
that the distance information matches the physical length of the cable, just as it does in the
S
21
measurement. Note that if the option parameter Reflection Calc in Time is set to One Way,
then the time domain example shown in Figure 8-1 would look more like the result shown in
Figure 8-2.
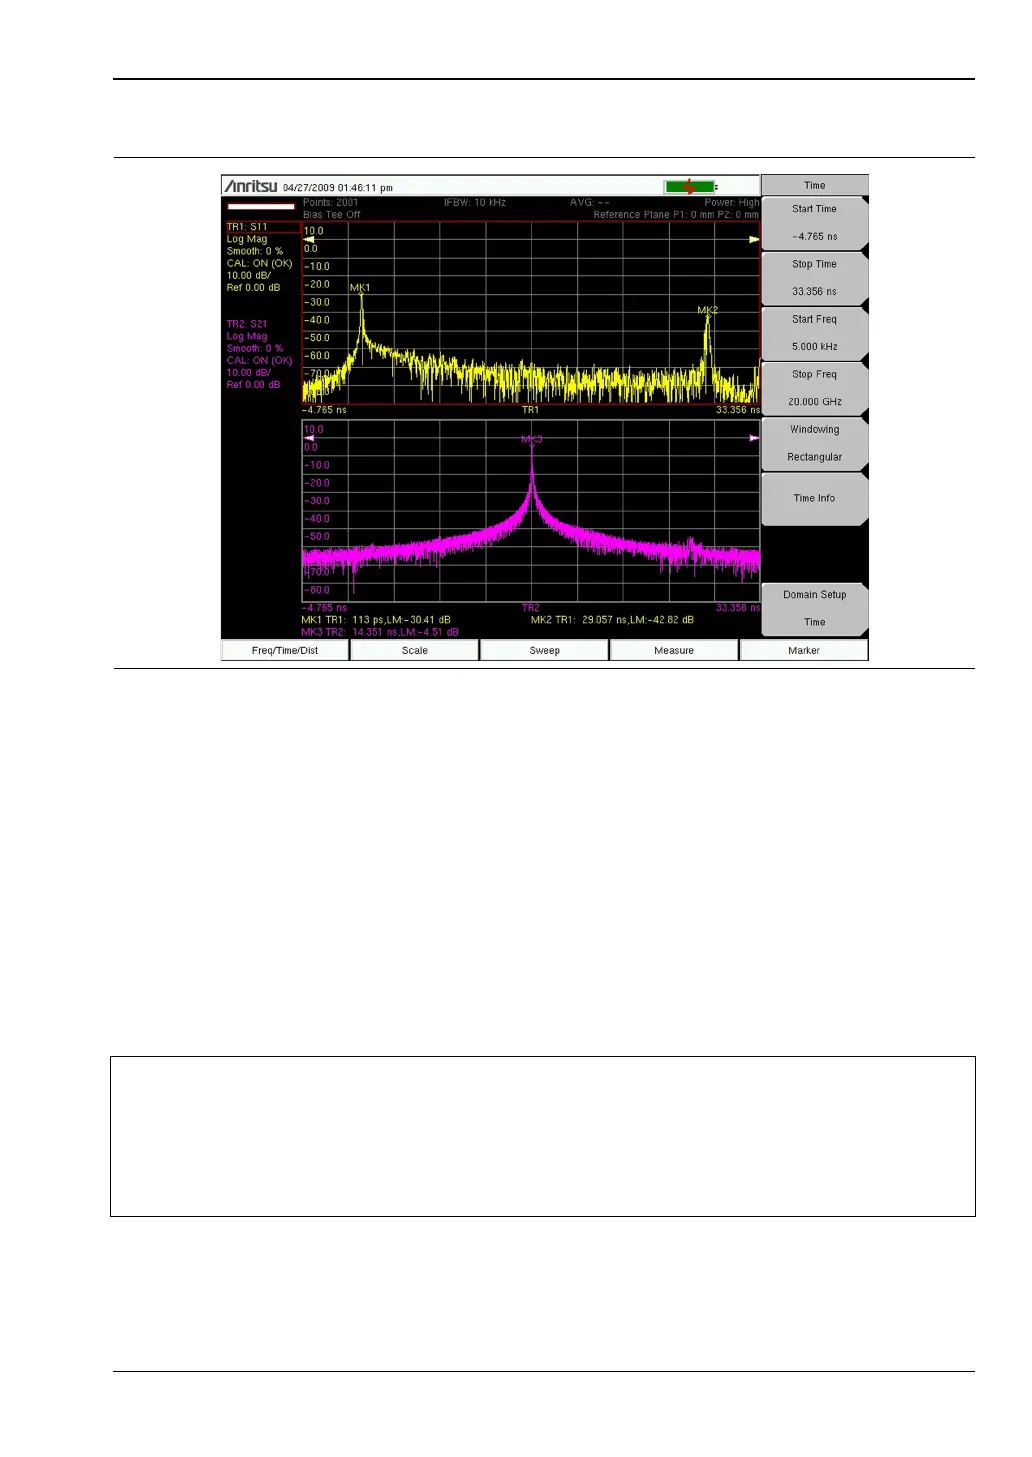
Figure 8-1. Time Domain Measurements of a 3.05 m Cable Showing S
11
and S
21
Caution
The measured cable had a propagation velocity of 70%, which was entered into
the VNA Master. Measurements in the distance domain use the entered
propagation velocity value to calculate the actual physical length of cables. If the
default value of 100% were used, then the measured cable length would be wrong
(4.4 meters in the above example). Time domain measurements are not
dependent on the propagation velocity values.