4-3 1-Port Smith Chart Tuning Example VNA Measurements
4-6 PN: 10580-00289 Rev. K Vector Network Analyzer MG
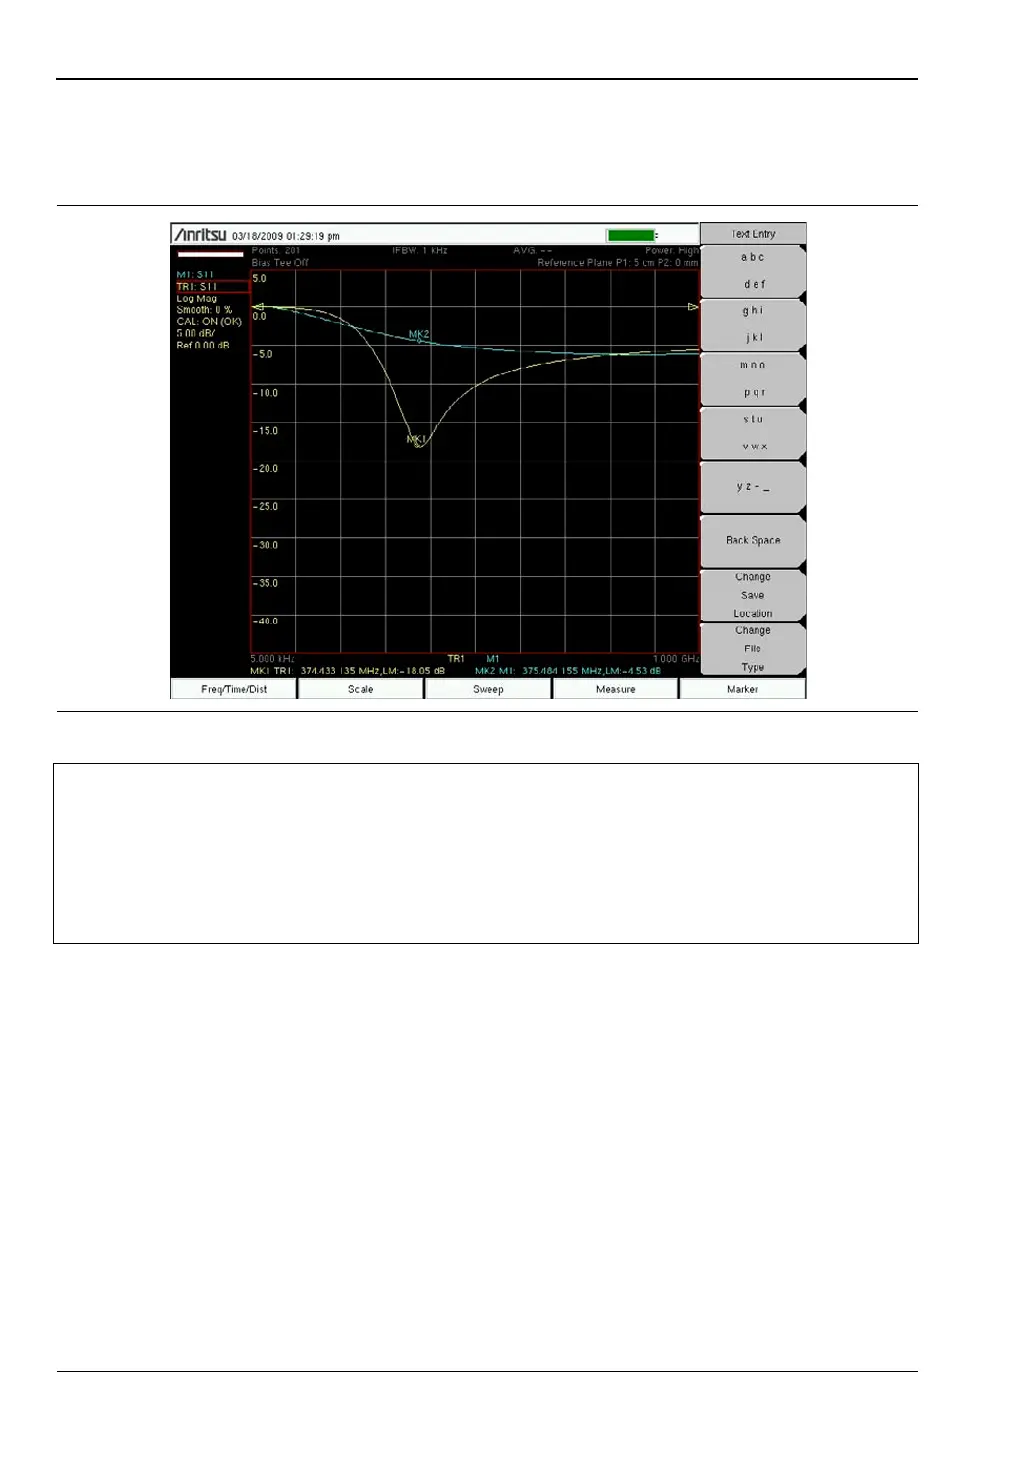
In Figure 4-4, the more familiar log magnitude response is showing the input match
improvement at 375 MHz. Trace 1 (shown in yellow with marker MK1) is the trace of the
tuned circuit.
Figure 4-4. Log Magnitude at 375 MHz
Note
Figure 4-4
In the electronic (PDF) file of this user guide, the traces are shown in color, and are
therefore easier to distinguish.
In the printed grayscale images, M1 drops smoothly from approximately 0 dB to
approximately –6 dB and utilizes marker MK2. Trace 1 (TR1) has nearly the same
end points, but dips to –18.05 dB, as shown at marker MK1.