4-4 2-Port Filter Measurement VNA Measurements
4-8 PN: 10580-00289 Rev. K Vector Network Analyzer MG
M1 and M2 are the full 12-term calibration responses. TR1 and TR2 are the responses from
the transmission response calibration.
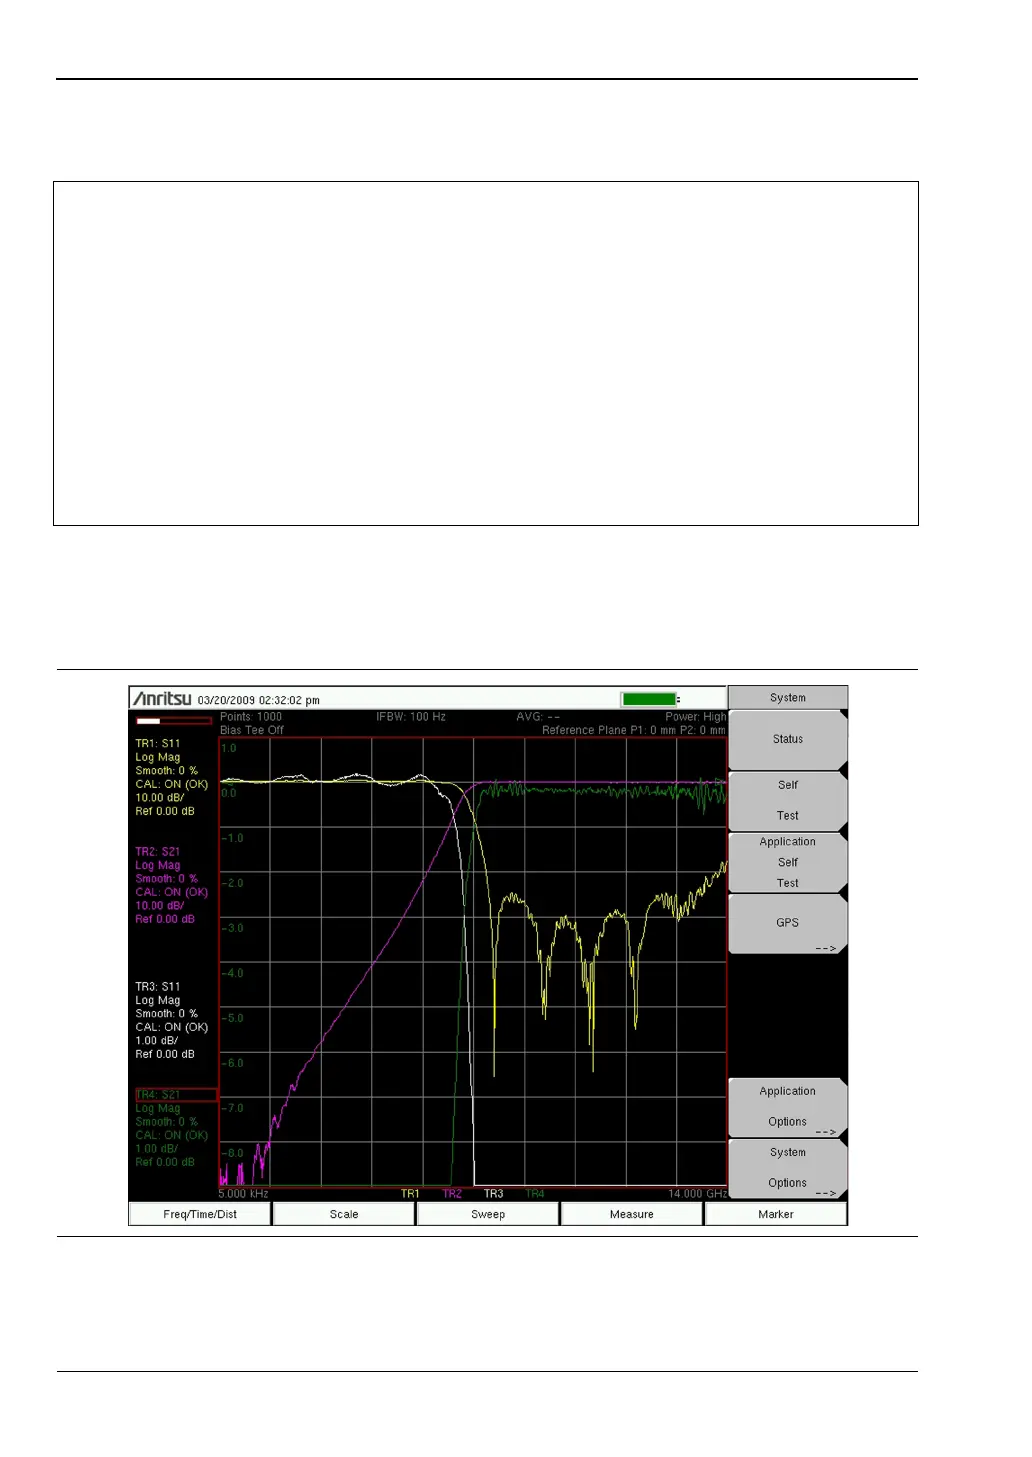
Because of the increased accuracy, full 2-port calibrations are generally the preferred
approach. Figure 4-6 shows a 4-trace display of the same filter (as illustrated in Figure 4-5)
showing S
11
and S
21
on 10 dB/div and 1 dB/div scales, highlighting the passband, the reject
band, and roll-off of the filter.
Note
Figure 4-5
In the electronic (PDF) file of this user guide, the traces are shown in color, and are
therefore easier to distinguish.
In the printed grayscale images, M1 and M2 are smoother than traces TR1 and
TR2.
M1 and TR1 begin at the low end of the frequency range at approximately 0 dB
and continue above –20 dB until mid frequency range. Then TR1 ranges between
approximately –10 dB and –50 dB, while M1 ranges to the bottom of the sweep
window, mostly below –30 dB.
M2 and TR2 begin at the low end of the frequency range below –60 dB and sweep
upward to approximately 0 dB at mid frequency range. They continue at
approximately 0 dB to the high end of the frequency range.
Figure 4-6. Highpass Filter with 2-Port Calibration, 10 dB/div and 1 dB/div