Patient Monitor User Manual Review
- 194 -
Chapter 24 Review
The monitor provides 150-hour trend data of all parameters, storage of 1200 NIBP measurement
results and 200 alarm events, 200 arrhythmia events and 50 sets of 12-lead analysis results. This
chapter gives detailed instruction for review of all data.
NOTE:
1 Parameter labels from external devices (ventilator/anesthesia device or LiDCO) are
suffixed with (V/A or Li).
2 For I:E (V/A), the data can be reviewed in trend table only.
24.1 Trend Graph Review
To review trend graph, please press the
Trend Graph
key on the screen or select
Menu
>
Review
>
Trend Graph
.
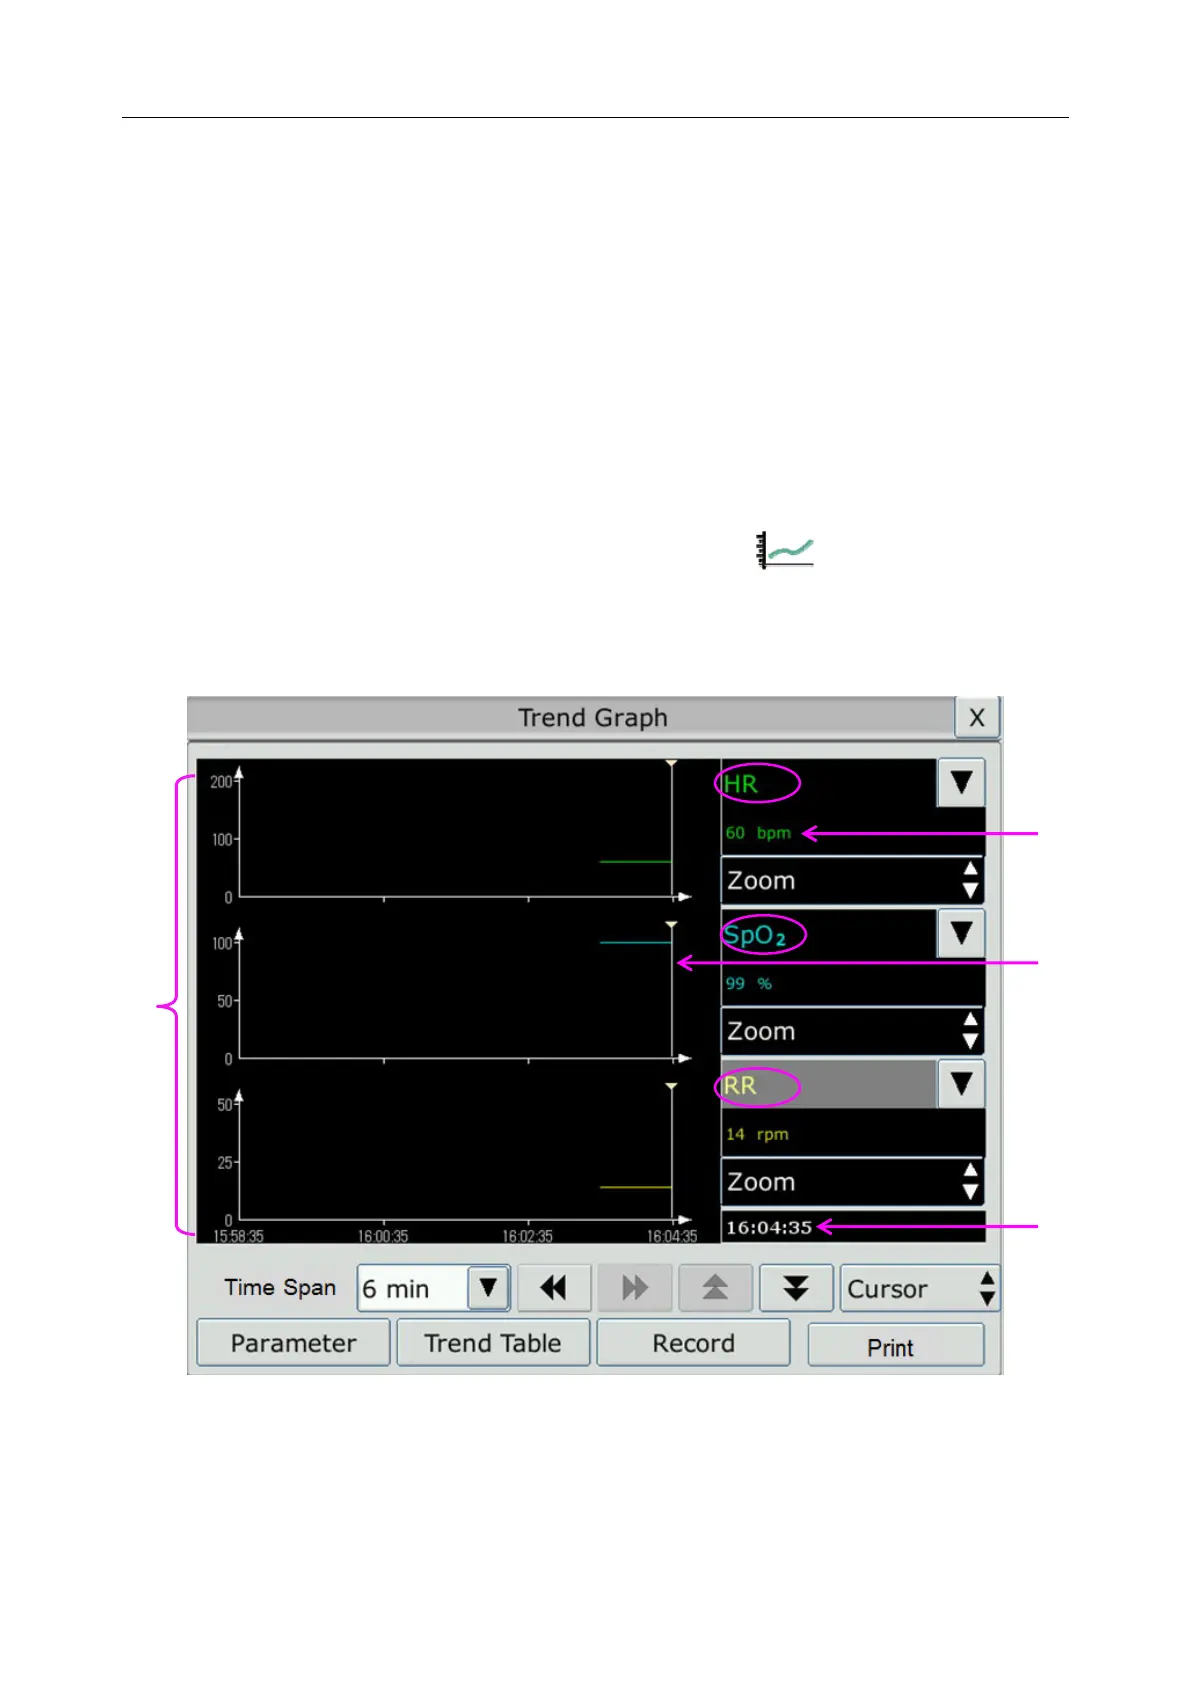
In the trend graph, the y-axis stands for the measurement value and x-axis stands for the time.
With the exception of NIBP, other trends are displayed as continuous curves.
1 Trend curve area
2
Trend data: displays measurement values at the cursor indicated time.
3
Cursor
4
Cursor time
1
2
3
4
 Loading...