Appendix for Lorrca® MaxSis
Page 200 Lorrca Maxsis User Manual
Version 5.04 MRN-231-EN
11.6.2.1.1. Deformability curve
When measuring a deformability curve (EI vs. shear stress), the RBC suspension is kept at an
adjustable temperature (usually 37 ºC). The applied shear stress is computer controlled and is
adjustable in the range 0.01 - 100 Pa. The laser light traverses the blood suspension and will
partially be diffracted by the RBCs. Under the influence of shear stress, RBCs elongate
accompanied by a shape change of the diffraction pattern. The following drawing shows how the
diffraction pattern is made visible on a small projection screen:
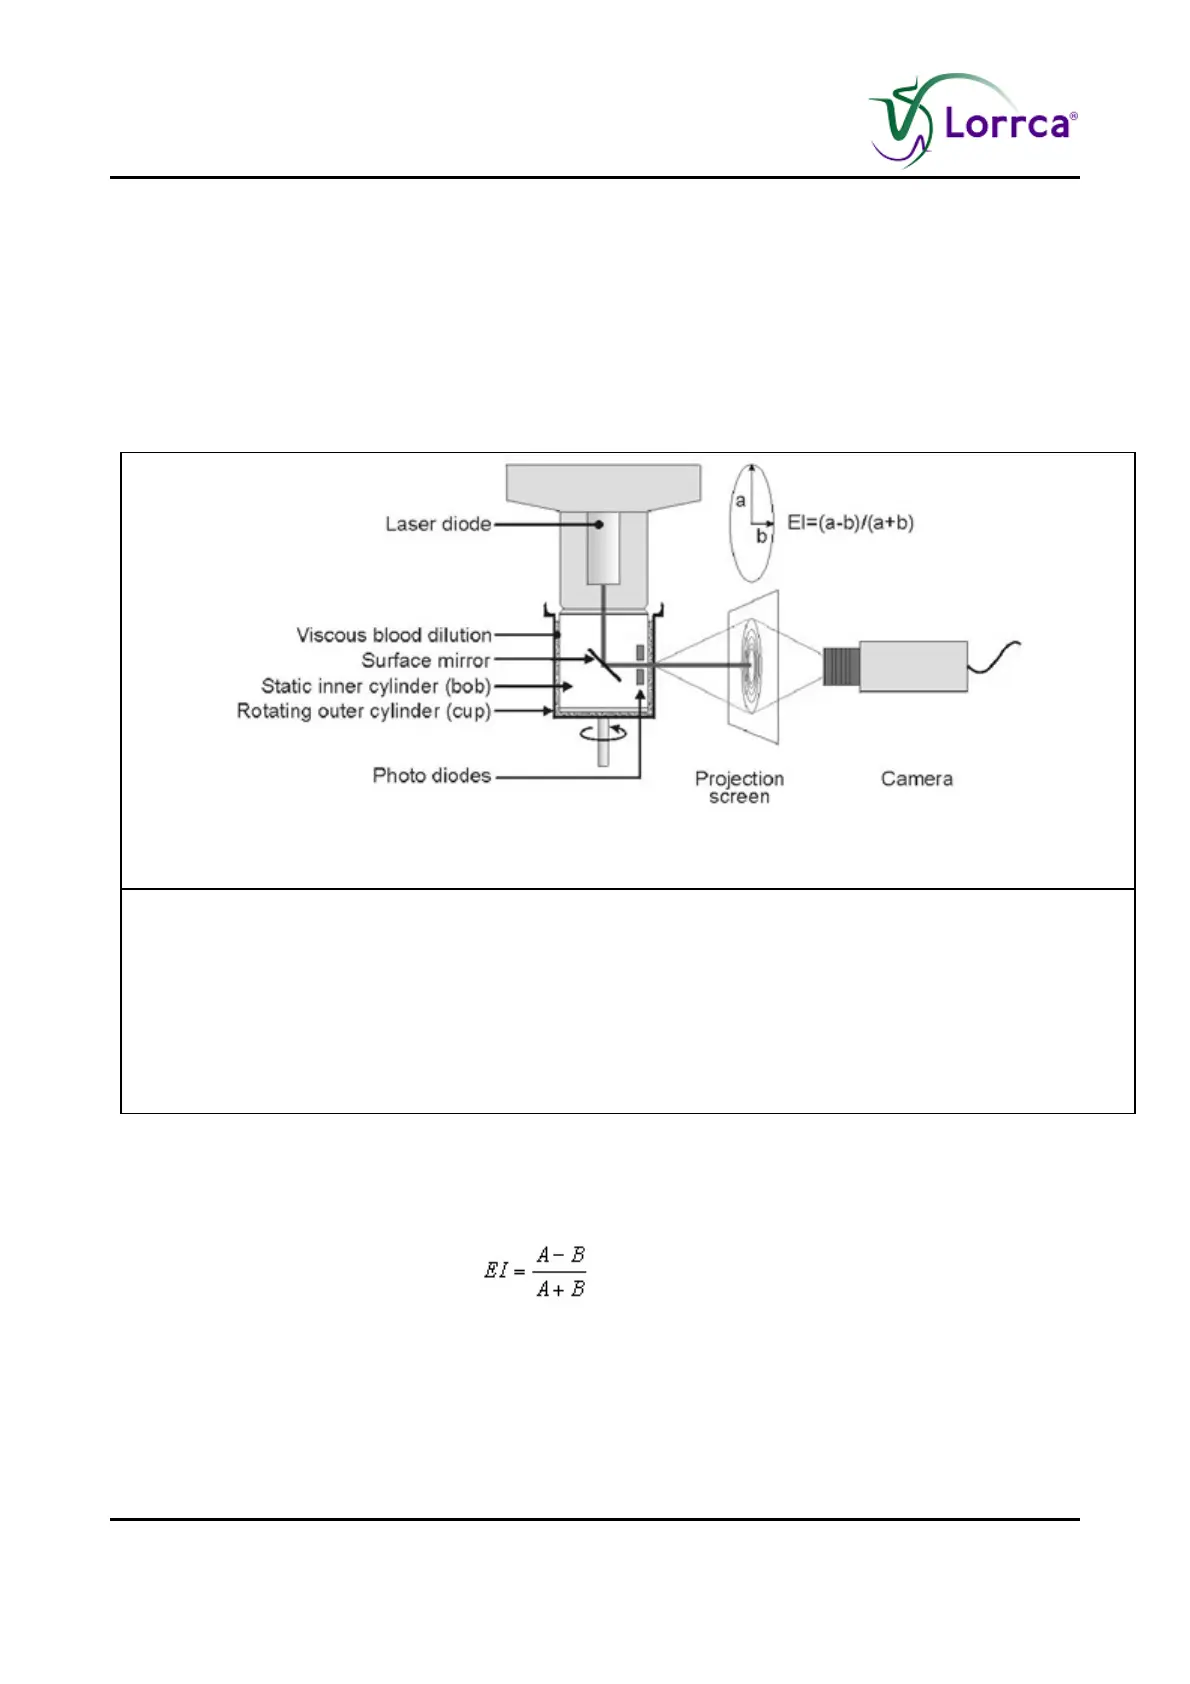
Figure 1: Principle of ektacytometry
Figure 1. Principle of ektacytometry. A laser beam is scattered by a
suspension of red blood cells stressed between a static inner cylinder
(BOB) and a rotating outer cylinder (CUP). The shape of the diffraction
pattern, projected on a small screen, is a measure for the average RBC
deformability and changes from circular at rest to elliptical at a high
shear stress. The major (a) and minor (b) axis of the ellipse serve to
calculate the elongation index, EI=(a-b)/(a+b). The photo diodes are used
for aggregation measurements using further the same geometry.
A video camera acquires the diffraction pattern from the projection screen and transmits it to the
image acquisition board of the PC. Finally, the computer calculates the best matching ellipse
(curve fit) and determines the Elongation Index (EI) from the horizontal (B) and vertical (A) axes
(Figure 1 and Figure 2) according to:
(Equation 3)
When deforming under increasing shear stress, RBCs change gradually from a biconcave towards
a prolate ellipsoid morphology and orient themselves along the flow vector in the gap, i.e.,
tangential to the axis. This is accompanied by a transition from a circular into an elliptic diffraction
pattern, which is oriented perpendicular to the orientation of the elongated cells. The elongation
program measures the EI at shear stresses in an optional range and draws EI vs. shear stress,
known as the deformability curve. Figure 2 shows this deformability curve and the shape of the
accompanying diffraction patterns.