Appendix for Lorrca® MaxSis
Lorrca Maxsis User Manual Page 201
Version 5.04 MRN-231-EN
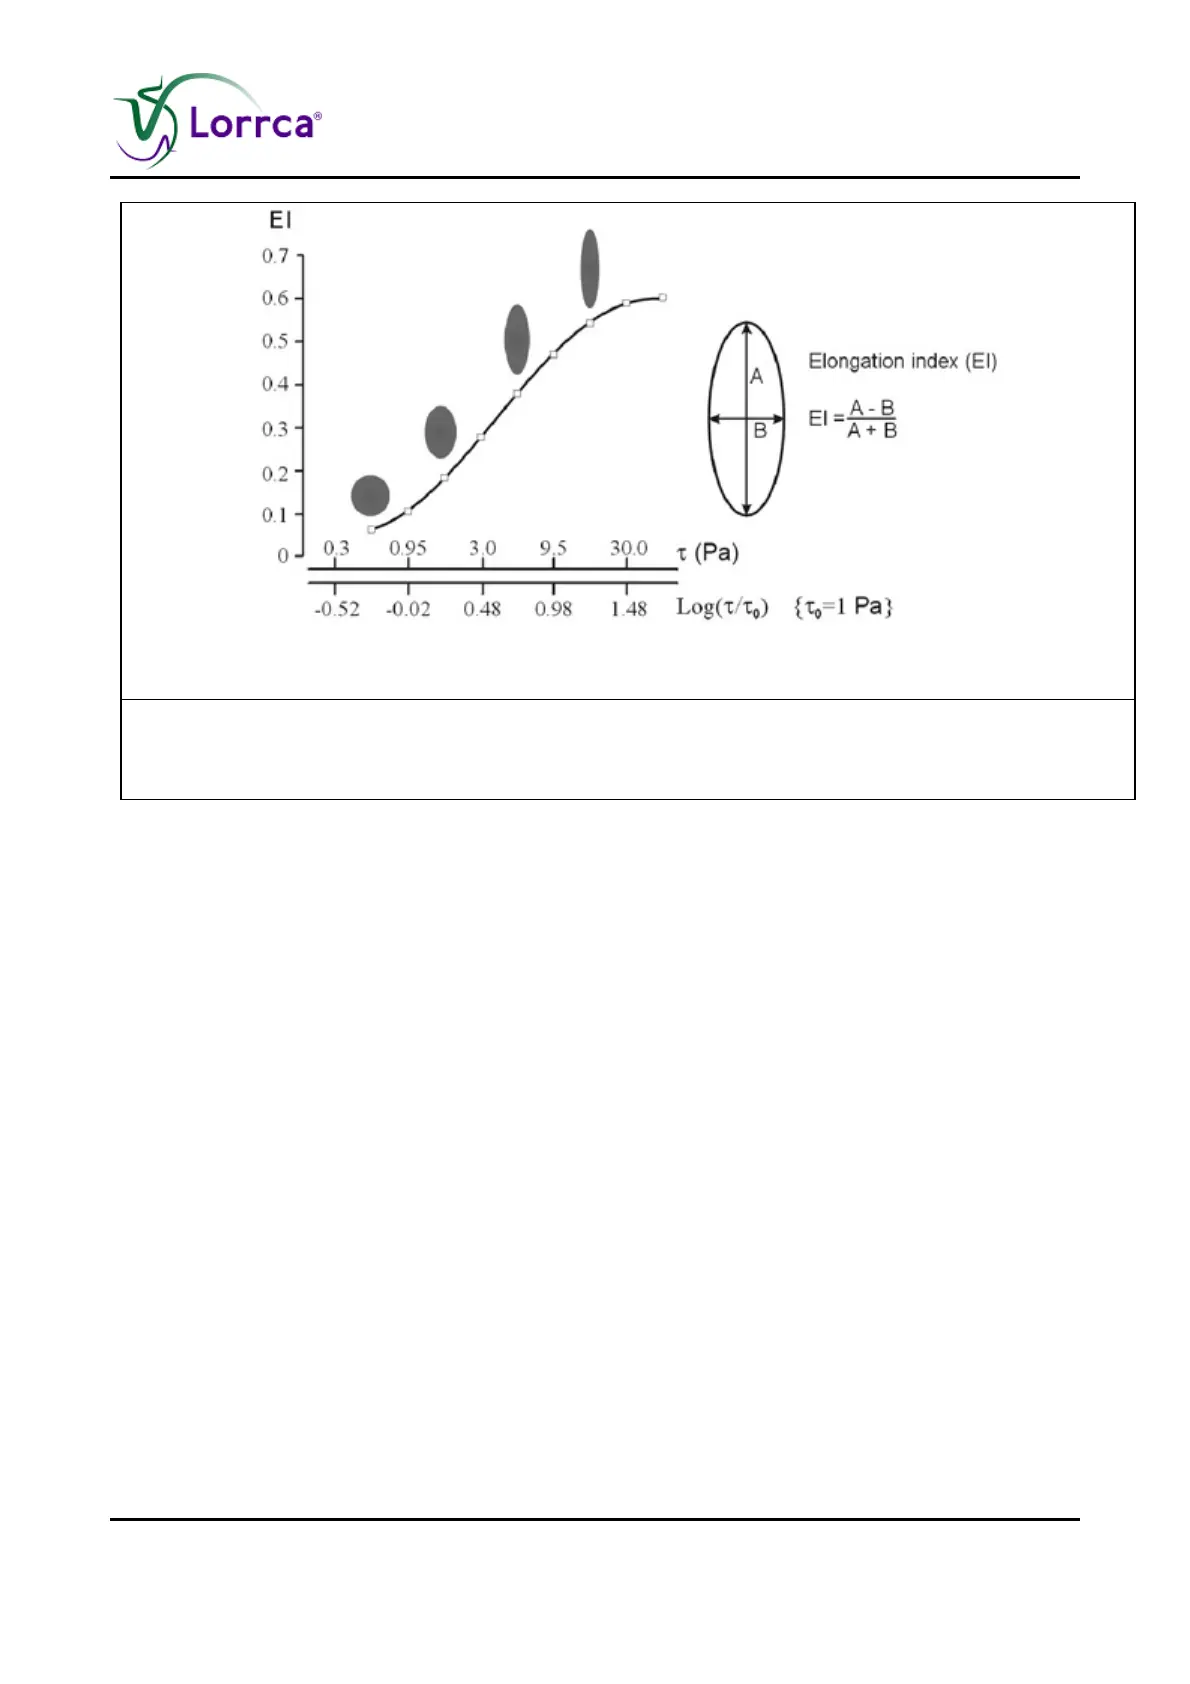
Figure 2: The RBC-deformability curve
Figure 2. The RBC-deformability curve shows the change in the diffraction
pattern during application of increased shear stress; calculation of
elongation index (EI).
11.6.2.1.2. Stability test
RBC stability
To perform a stability test for RBC, the cells are considerably deformed by a, user defined, high
shear stress for a certain time period. The effect on the cells can be followed, either during the
stress application period by the intermittent measurements of their deformability at a fixed shear
rate, or by the measurement of a complete deformation curve before and after stress application.
Thus, the same LORCA geometry as given in Figure 1 is used for both applying the shear stress
and analysing the result of it.
Monitoring the decrease of RBC deformability is, compared to hemolysis, an early indication of
shear induced cell damage (REF Sung Sik Lee).