Appendix for Lorrca® MaxSis
Page 212 Lorrca Maxsis User Manual
Version 5.04 MRN-231-EN
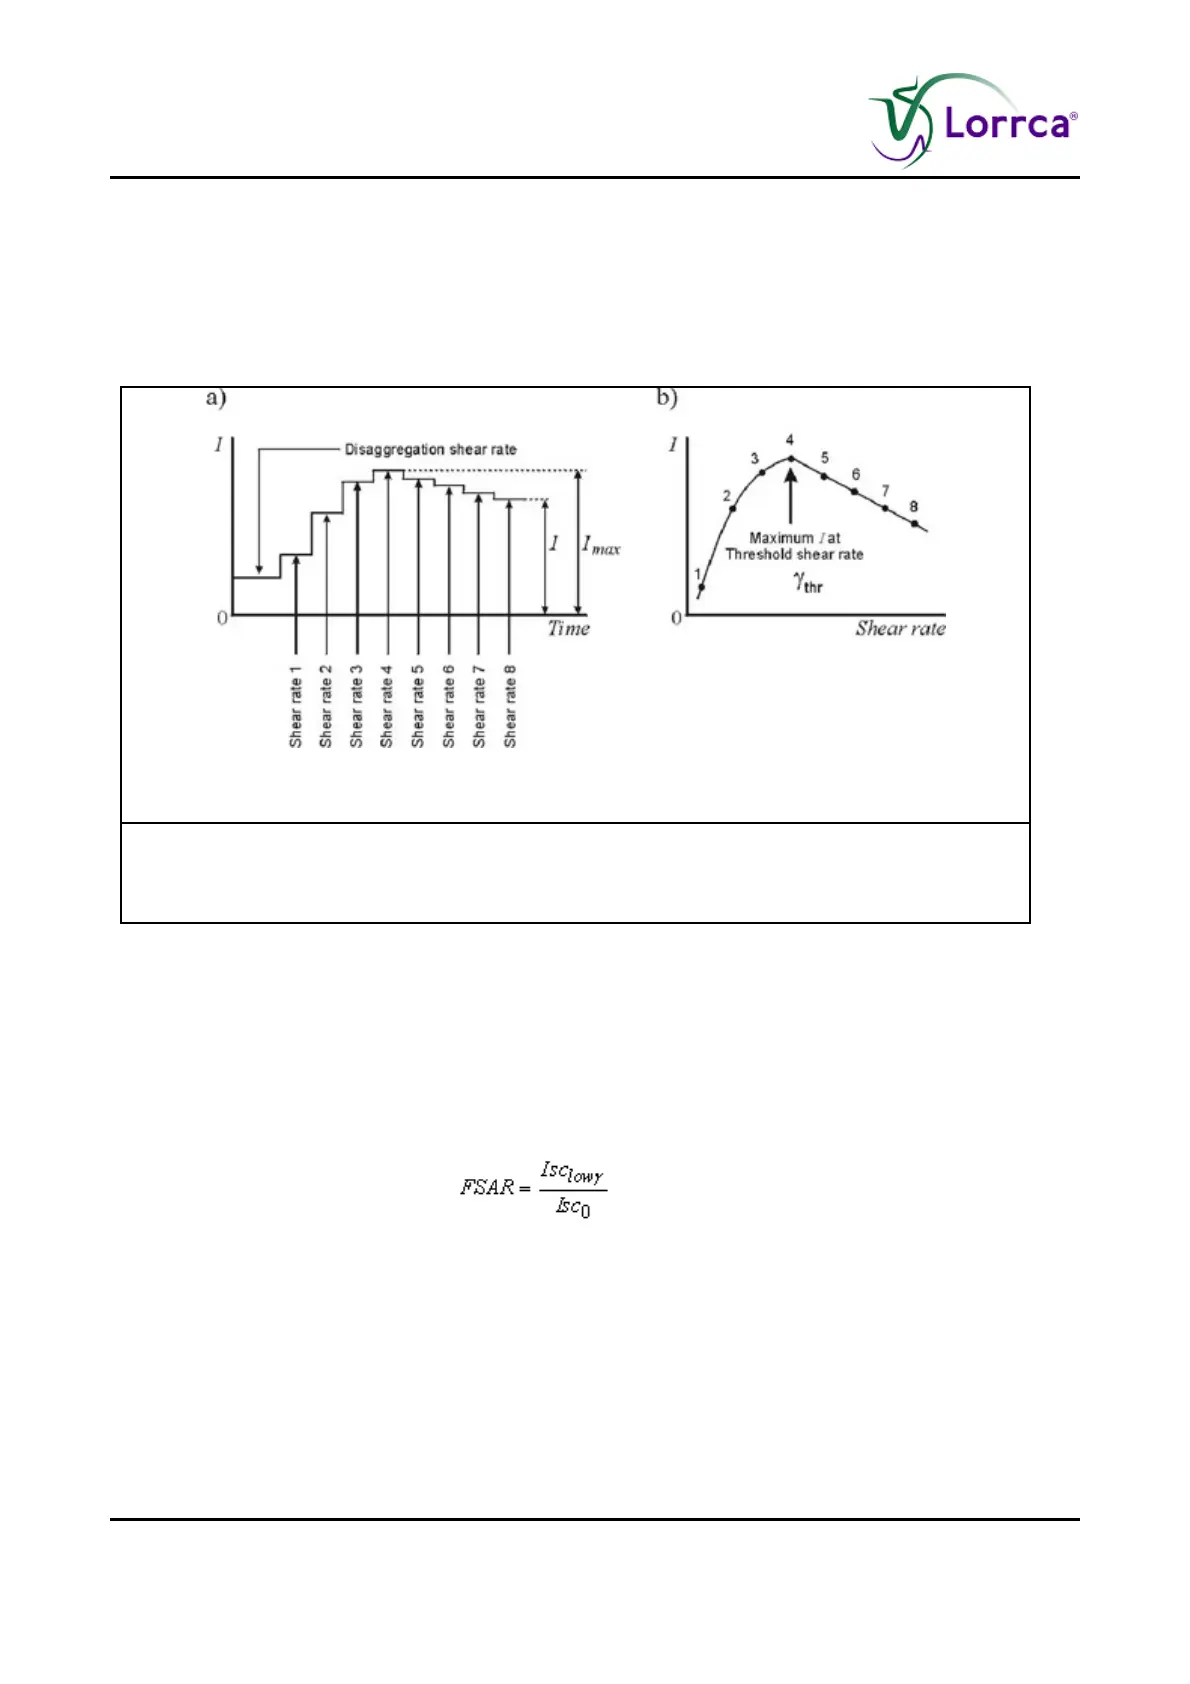
Without intermediate disaggregation.
This mode (Figure 8) is very similar to the former but without intermediate disaggregation. The
absolute value of the back scatter intensity at each shear rate serves to determine Isc vs. shear
rate. The threshold shear rate is taken where the back scatter intensity is the highest. Note that
some aggregates might still remain at the threshold shear rate. Therefore, during the iteration
procedure, the back scatter level (aggregation level) at the threshold shear rate may differ from
the peak value in the Syllectogram.
Figure 8: Iteration procedure without intermediate disaggregation
Figure 8. Iteration procedure without intermediate disaggregation.
After disaggregating the sample once, the program determines the
back-scatter intensity (Isc) vs. shear rate.
11.6.2.3. Flow to Stasis Aggregation Ratio (FSAR)
To get an indication whether there is any additional (secondary) aggregation at low flow, the ratio
of the back scatter intensity at an optional low shear rate, e.g. 10 s-¹ (Isc
10
) and Isc at stasis (Isc
0
)
can be calculated. In case of additional flow-induced aggregation (lower Isc), a Flow-to-Stasis
Aggregation Ratio (FSAR) value of <1 can be expected.
(Equation 5)
Usually, however, FSAR values are > 1, meaning that there is rather breakdown of aggregates due
to flow than hyper aggregate formation.