Appendix for Lorrca® MaxSis
Page 206 Lorrca Maxsis User Manual
Version 5.04 MRN-231-EN
11.6.2.2.1. Syllectometry
Syllectometry as originally described by Zijlstra (References (on page 215) 10,65) is commonly
employed to measure RBC aggregability. (References
(on page 215)
6,22,23,31,36,44,48,54,57) In this
method blood is illuminated and subjected to shear stress, causing the cells to deform and align in
the direction of the flow (Figure.5). The change in back scattered light is measured after the driving
mechanism stops. (The time needed for the suspension to come to a stop influences the
syllectogram and its derived parameters for large gaps (> 0.6 mm), see References (on page 215)
15 or 16 for details.) The resultant time-dependent intensity plot is called a syllectogram. A high
intensity peak shows up at the beginning of the plot as cells return to their original randomly-
oriented biconcave shape and lose their alignment. The intensity of the back scattered light
decreases as aggregation proceeds. A mathematical representation of the syllectogram yields
aggregation parameters that are used to assess RBC aggregability. (References (on page 215)
6,23,31)
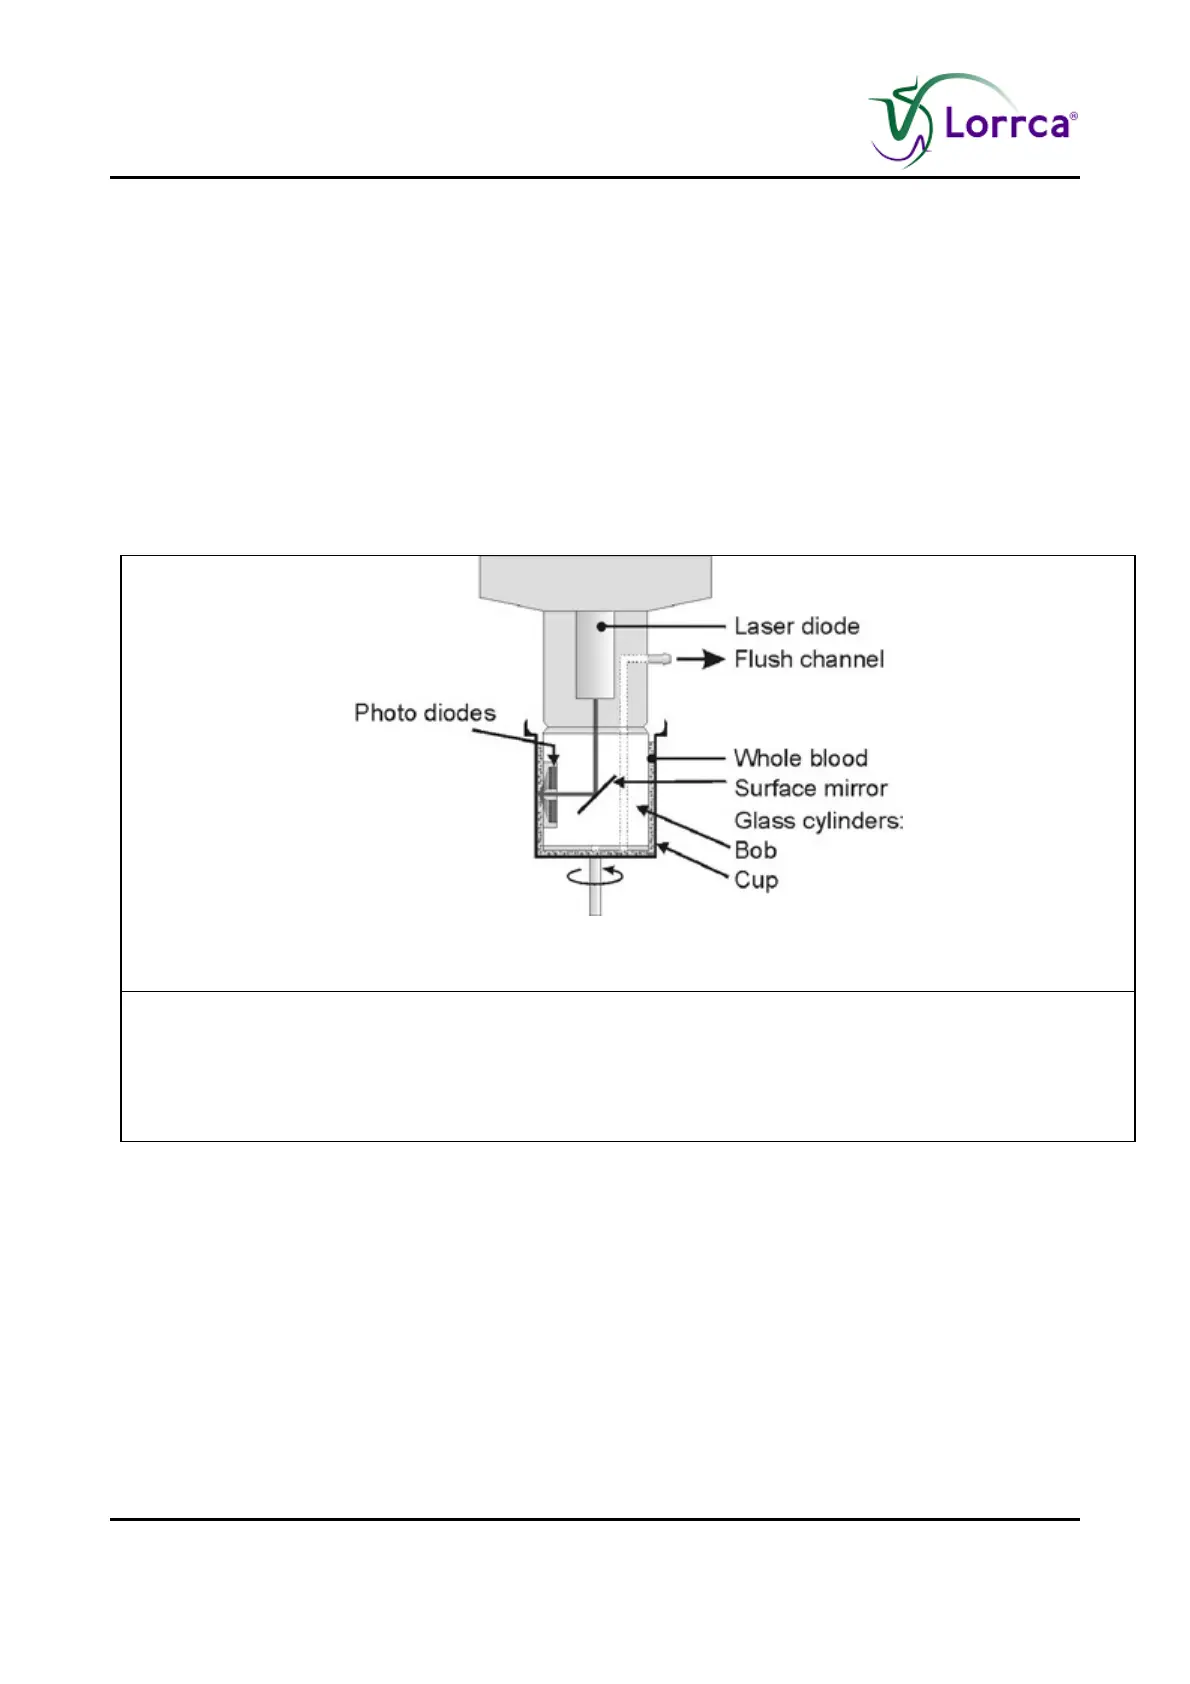
Figure 5: LORCA aggregometer setup
Figure 5. LORCA aggregometer setup. A laser beam is incident on a layer of
blood between a static inner cylinder (BOB) and a rotating outer cylinder
(CUP). Back-scattered light is collected by two photo diodes. Electrical
voltage that is represented by the intensity scale of the syllectogram
(range: 0 – 100 arbitrary units).
In a syllectogram, four RBC-behavioural stages are distinguished (Figure 6).
These are:
1. The initial plateau during the disaggregation stage originates from the light that is back
scattered by the elongated RBCs that are aligned in the direction of the flow. The intensity of
the light relates to the state of elongation and thus depends on the shear rate.
2. In the shape-recovery stage that follows immediately after cup cessation, cells collectively lose
their alignment and return to their biconcave resting shape. The recovery stage is accompanied
by an exponential increase in light back-scatter (References (on page 215) 5,34,59) leading to
a high intensity peak in the syllectogram.