Appendix for Lorrca® MaxSis
Lorrca Maxsis User Manual Page 207
Version 5.04 MRN-231-EN
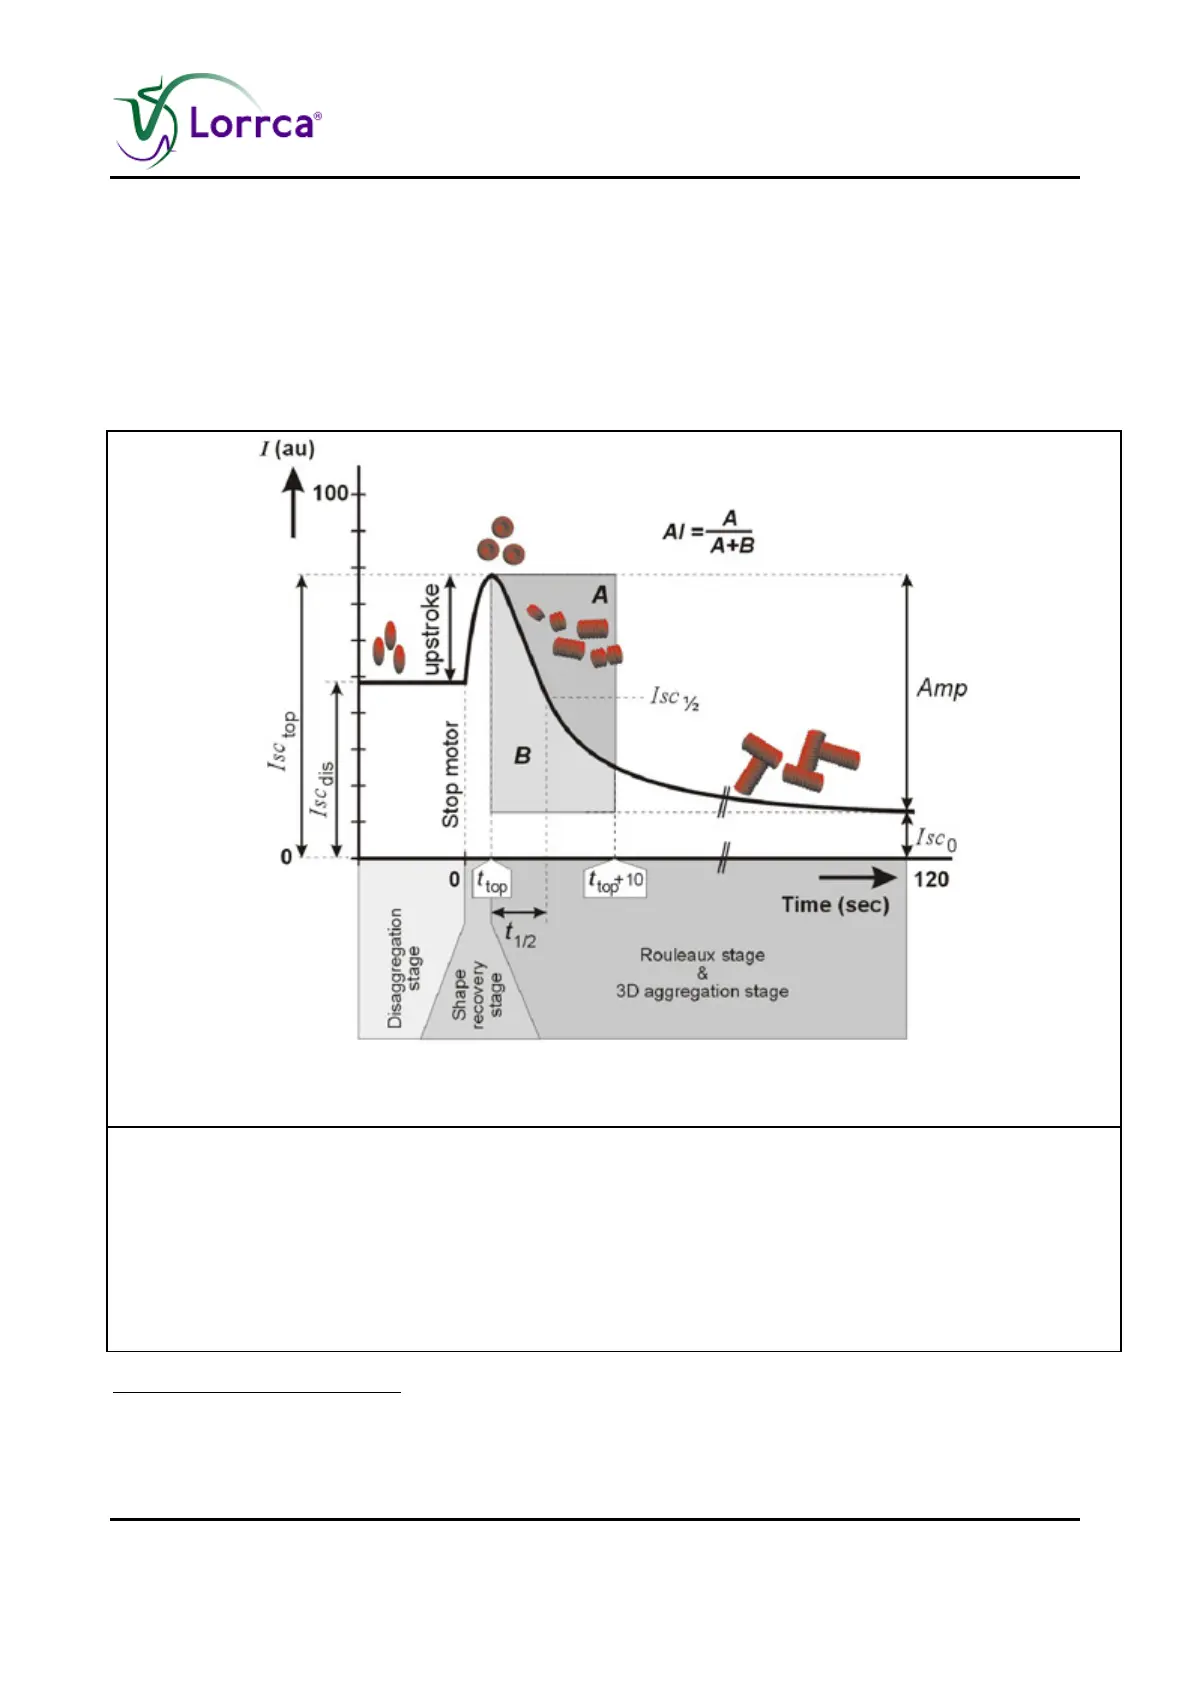
3. Aggregation starts during the shape-recovery stage when external shear forces fail to keep the
RBCs dissociated. RBCs start to aggregate side-to-side as stacks of coins, called rouleaux,
causing the back-scatter of light to decrease exponentially (Reference 25
21
) with a time-
constant of about 1 -3 s in normal human blood.
5. Rouleaux formation is immediately followed by so-called 3D aggregate formation during which
rouleaux connect end-to-end as well as side-to-end, creating larger 3D aggregates. In normal
human blood, the formation of 3D aggregates is a slower process (Reference 6
22
) with a time-
constant of about 10 - 25 s.
21
Groner W., Mohandas N., Bessis M., New optical technique for measuring erythrocyte deformability with
the Ektacytometer, Clin. Chem., vol. 26:(10), pp. 1435-1442, 1980.
22
Bauersachs R.M., Wenby R.B., Meiselman H.J., Determination of specific red blood cell aggregation
indices via an automated system, Clin. Hemorheol., vol. 9, pp. 1-25, 1989.
Figure 6: The syllectogram distinguishes four behavioural stages
Figure.6. The syllectogram distinguishes four behavioural stages:
1. Disaggregation,
2. RBC-shape recovery,
3. Rouleaux formation immediately followed by
4. 3D aggregate formation.
The peak duration is exaggerated. au = arbitrary units.