LumaSMART
®
User Manual Using the Software • 75
To set a custom date:
1. Set a custom date by first selecting the year. After you select the year, the Select Month will be available,
followed by the Select Day.
Note: The dates that can be selected are confined to those that represent dates of existing Data
Logs. If a specific date is not available, then no Data Log for that day exists.
2. Select the channels to confine the range of channels displayed on the graph.
3. If desired, mark the selection for Plot Temperature and/or Plot Signal Strength.
4. Press Exit to leave the graphing function and return to the LumaSMART screen.
5. Press Press to View Temp/Time Graph for Selected Day to view the graph::
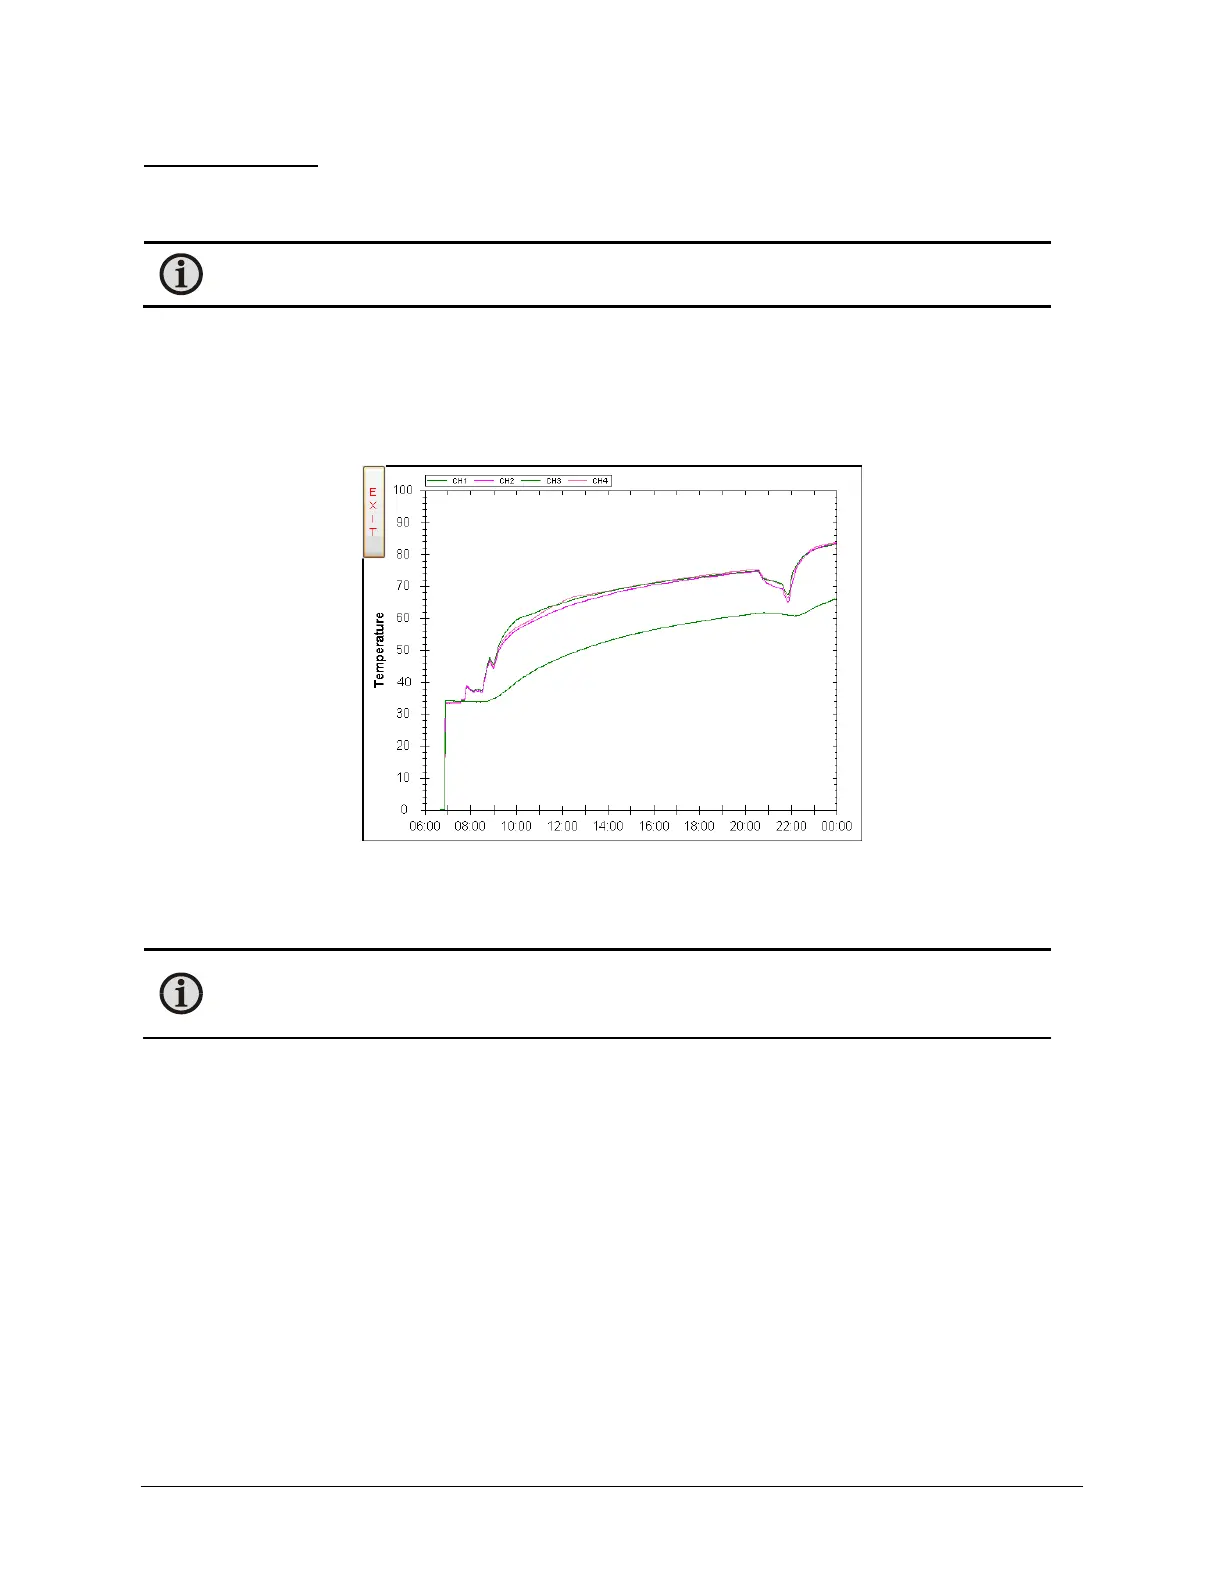
Data Log Graph
The graph will show the hour of the day across the bottom (x) scale and the temperature across the vertical (y)
scale.
Note: A temperature value of zero (0) is displayed when no data for a probe is available. This
includes time when power is removed from the LumaSMART or a channel was not functioning
properly.
In the above graph, the LumaSMART was turned off until about 7AM.
Press Exit to remove the graph and return to the Date Selection screen.
 Loading...