LumaSMART
®
User Manual Using the Software • 76
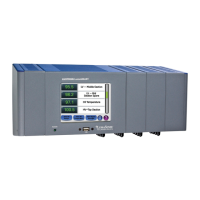
Data Graph Zoom Feature
To highlight and zoom in on an area of the graph, touch and hold a corner, without lifting, drag to the opposing
corner of interest. The selected area that will be zoomed in on will have a dotted line drawn around it, as shown
below by the dashed box in the upper right portion of the display.
Data Log Graph Zoom Selection
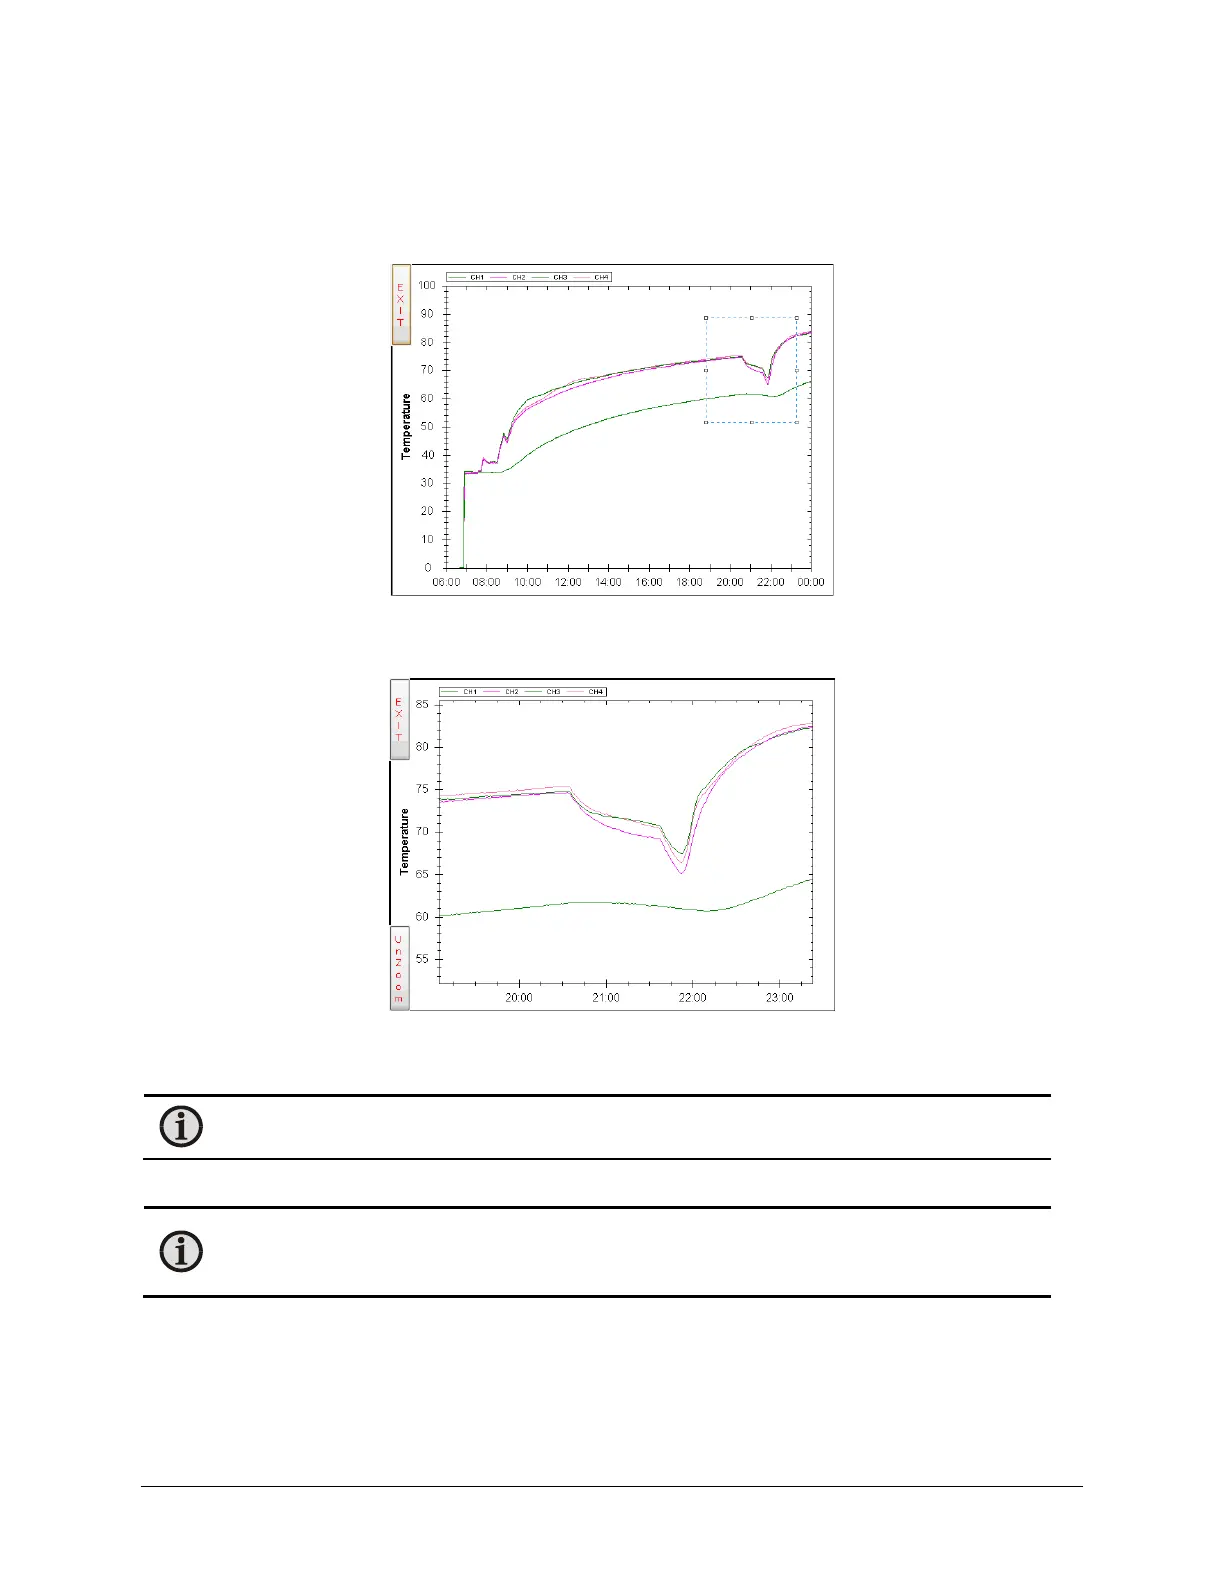
The graph will then redraw with the previously selected area, as shown below:
Data Log Viewer Zoomed View
When zoomed, the Temperature and Time scales will automatically adjust for the selected view.
Note: After zooming in on an area, you can continue to zoom in by repeating the Highlighting and
Selection process.
To return to the original view, press the UnZoom button.
Note: The graph will initially adjust for the time span contained in the Data Log file. If daylight
savings time (DST) is in effect, a transitional day associated with exiting DST is plotted and the graph
will show all 25 hours.
The graphing utility is licensed under the GNU Lesser Public Licensing from ZedGraph Class Library - A Flexible Line
Graph/Bar Graph Library in C# Copyright © 2007
 Loading...