A Advanced Reports - Python Module
PYTHON REPORTS
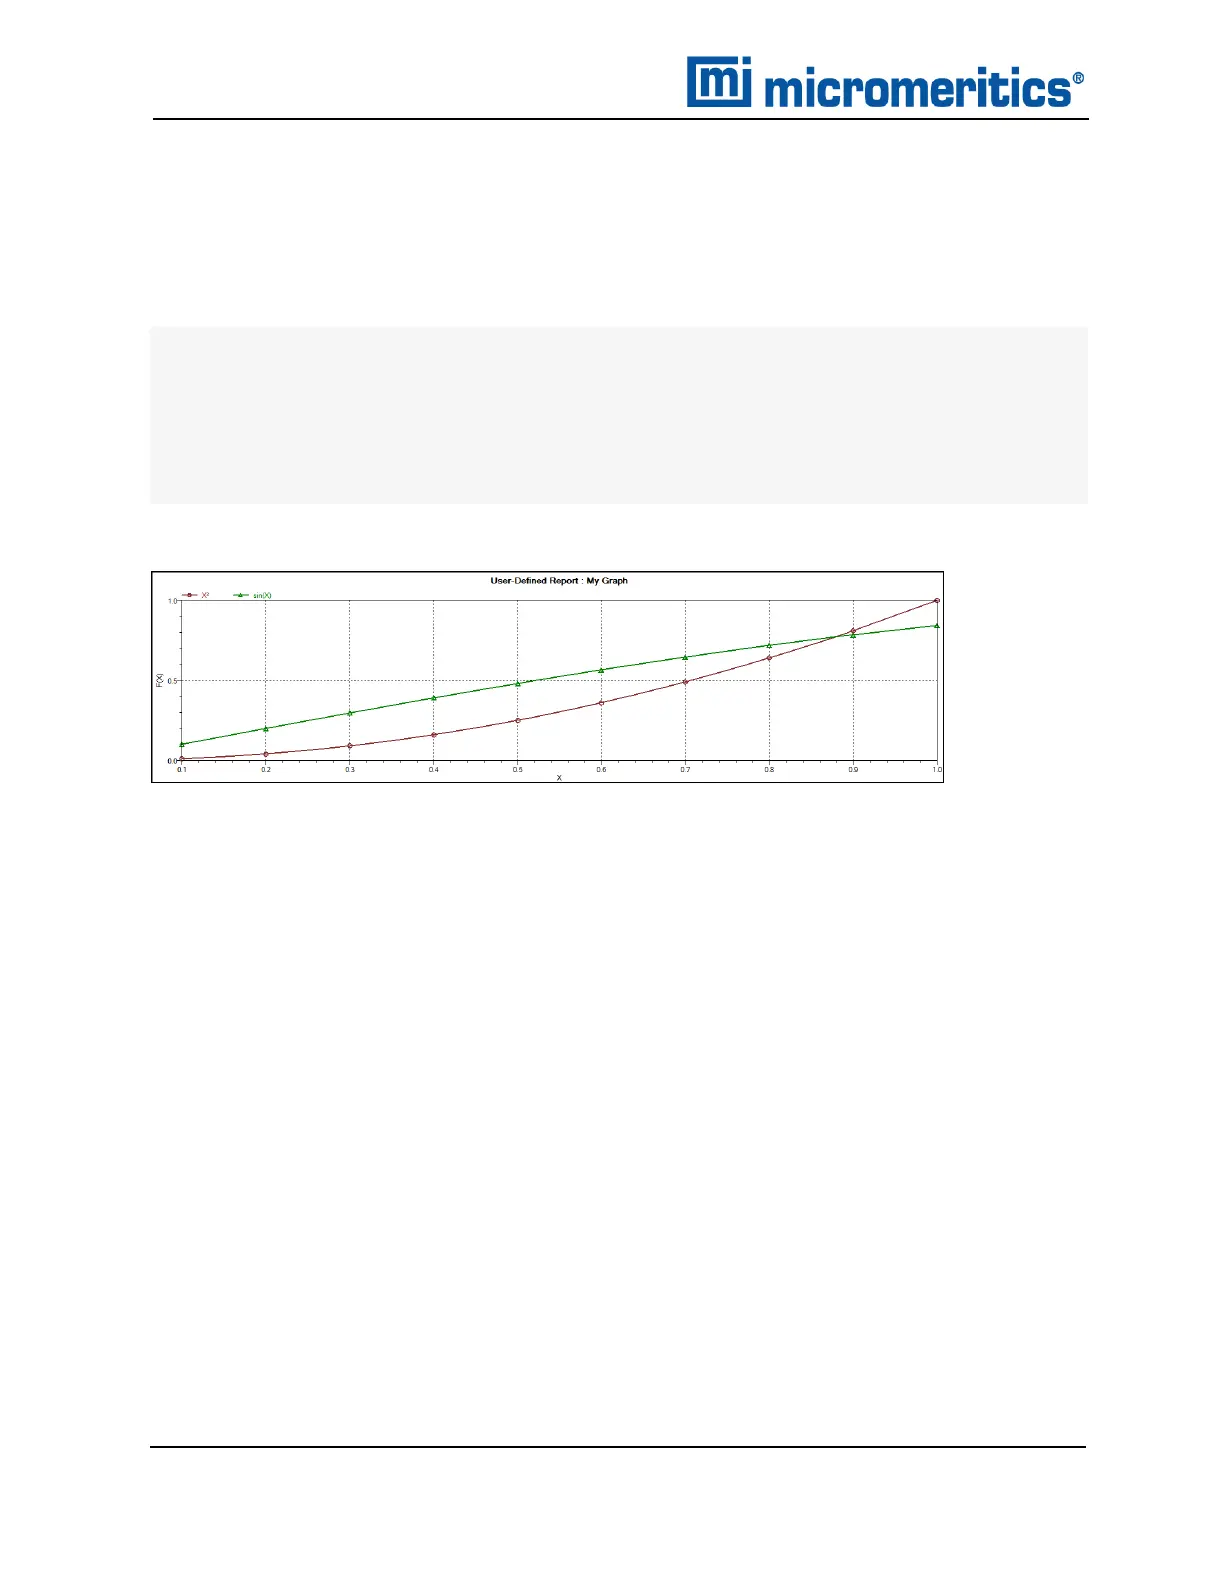
GRAPHIC REPORT
This script is an example of the mic module producing a graph with two curves:
import mic
import numpy as np
mic.graph( 'My Graph', 'X', 'F(X)' )
myx = np.array( [0.1, 0.2, 0.3, 0.4, 0.5, 0.6, 0.7, 0.8, 0.9, 1.0 ] )
mic.graph.add( 'X
2
', myx, myx*myx, marker='o' )
mic.graph.add( 'sin(X)', myx, np.sin(myx), marker='^' )
The results are:
A - 8
AccuPyc II 1345 Operator Manual
134-42851-01 (Rev A) — Jan 2021
 Loading...


