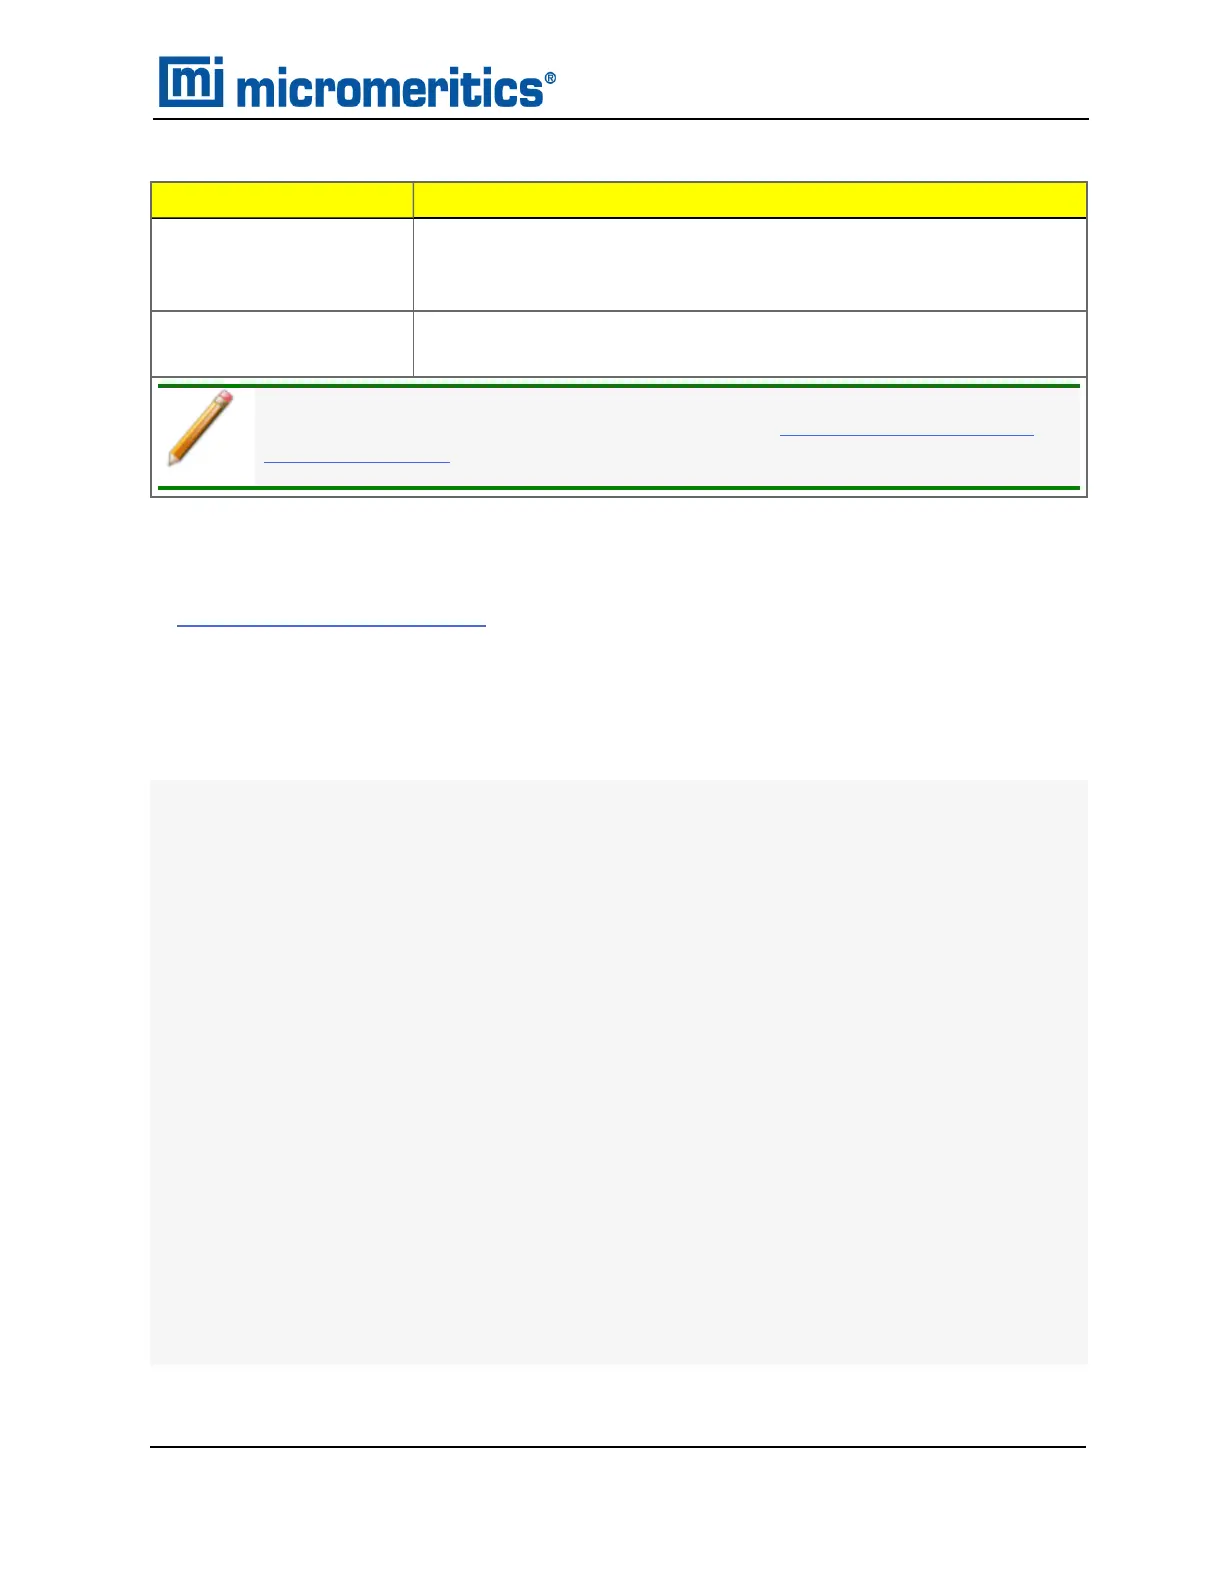
Field or Button
Description
Advanced Report 1
through 5
[drop-downbox]
Use the drop-down lists to select currently-defined functions used to
define the report calculations and output.
Available Scripts
[groupbox]
Lists the available reports and provides the option to add, replace, edit,
or remove reports.
For fields and buttons not listed in this table, see Common Fields and But-
tons on page3 - 2.
Advanced Reports
GRAPHIC REPORTS
n Python Reports on pageA - 8
ADD A CURVE
This script adds a curve to the last created graphical report:
mic.graph.add(name, x, y, yyaxis=False, color=None, linestyle='-',
marker='a', graphtype='both', interpolation='akima'):
Keyword arguments:
name --- the curve name
x --- list of x values; must be a list of floats
(or convertible) and the same length as y
y --- list of y values; must be a list of floats
(or convertible) and the same length as x
yyaxis --- place this curve on the yy-axis if True
otherwise place on the y-axis (default = False)
color --- RGB color as an HTML hex string (e.g., '#4169e1')
or a three-element list or tuple (e.g., [65,105,225]);
if None, color is automatically selected (default = None)
linestyle --- line style; (default = '-')
'-' : solid
'--' : dash
'.' : dot
'-.' : dash dot
'-..' : dash dot dot
marker --- marker shape; (default = 'a')
'+' : plus
Graphic Reports
AccuPyc II 1345 Operator Manual
134-42851-01 (Rev A) — Jan 2021
A - 3
 Loading...
