Field or Button
Description
logarithmic.
Scale font. Use to modify the font for the scale label. Deselect Use
default font to enable font options.
Title. Use to edit the selected axis label.
Title font. Use to modify the font for the selected axis label. Deselect
Use default font. Select new font attributes for report data. Enable Use
default font to reset default fonts.
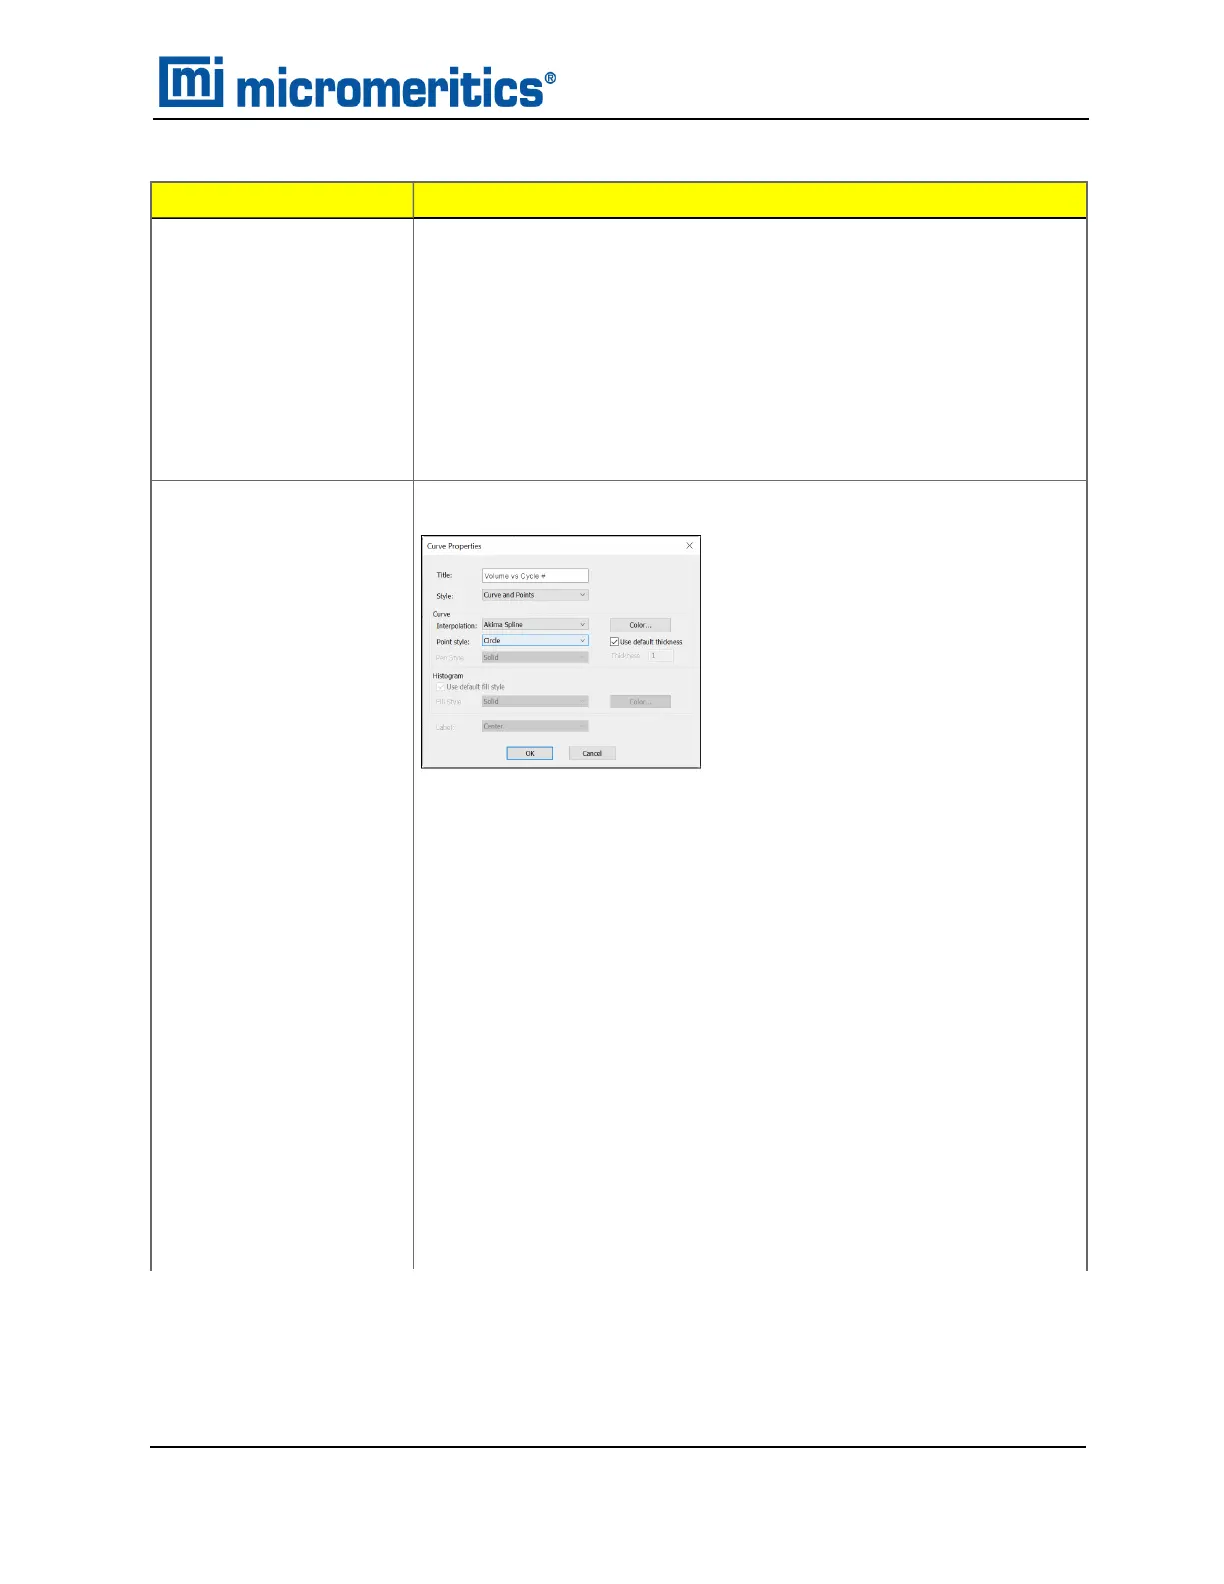
Edit curve
Use to edit selected curve properties.
Color. Click to change the curve color.
n Curve group box. Use to change the interpolation, point style and
pen style for the selected curve. These options are disabled if Use
default fill style is selected in the Histogram group box.
n Histogram group box. Enabled only if Histogram is selected in
the Style drop-down list. Use to specify the type of fill, fill color and
label position for the selected curve.
Label. Select where the graph point labels will display (left, right,
center, etc.) on the SPC report.
Style. Use to select another style for the collected data curve.
Title. Use to change the title of the selected curve.
Use default thickness. Uses the default curve thickness. Deselect to
enter a new thickness number in the Thickness text box.
Graph Shortcuts Options (continued)
Graph Features and Shortcuts
AccuPyc II 1345 Operator Manual
134-42851-01 (Rev A) — Jan 2021
7 - 11
 Loading...


