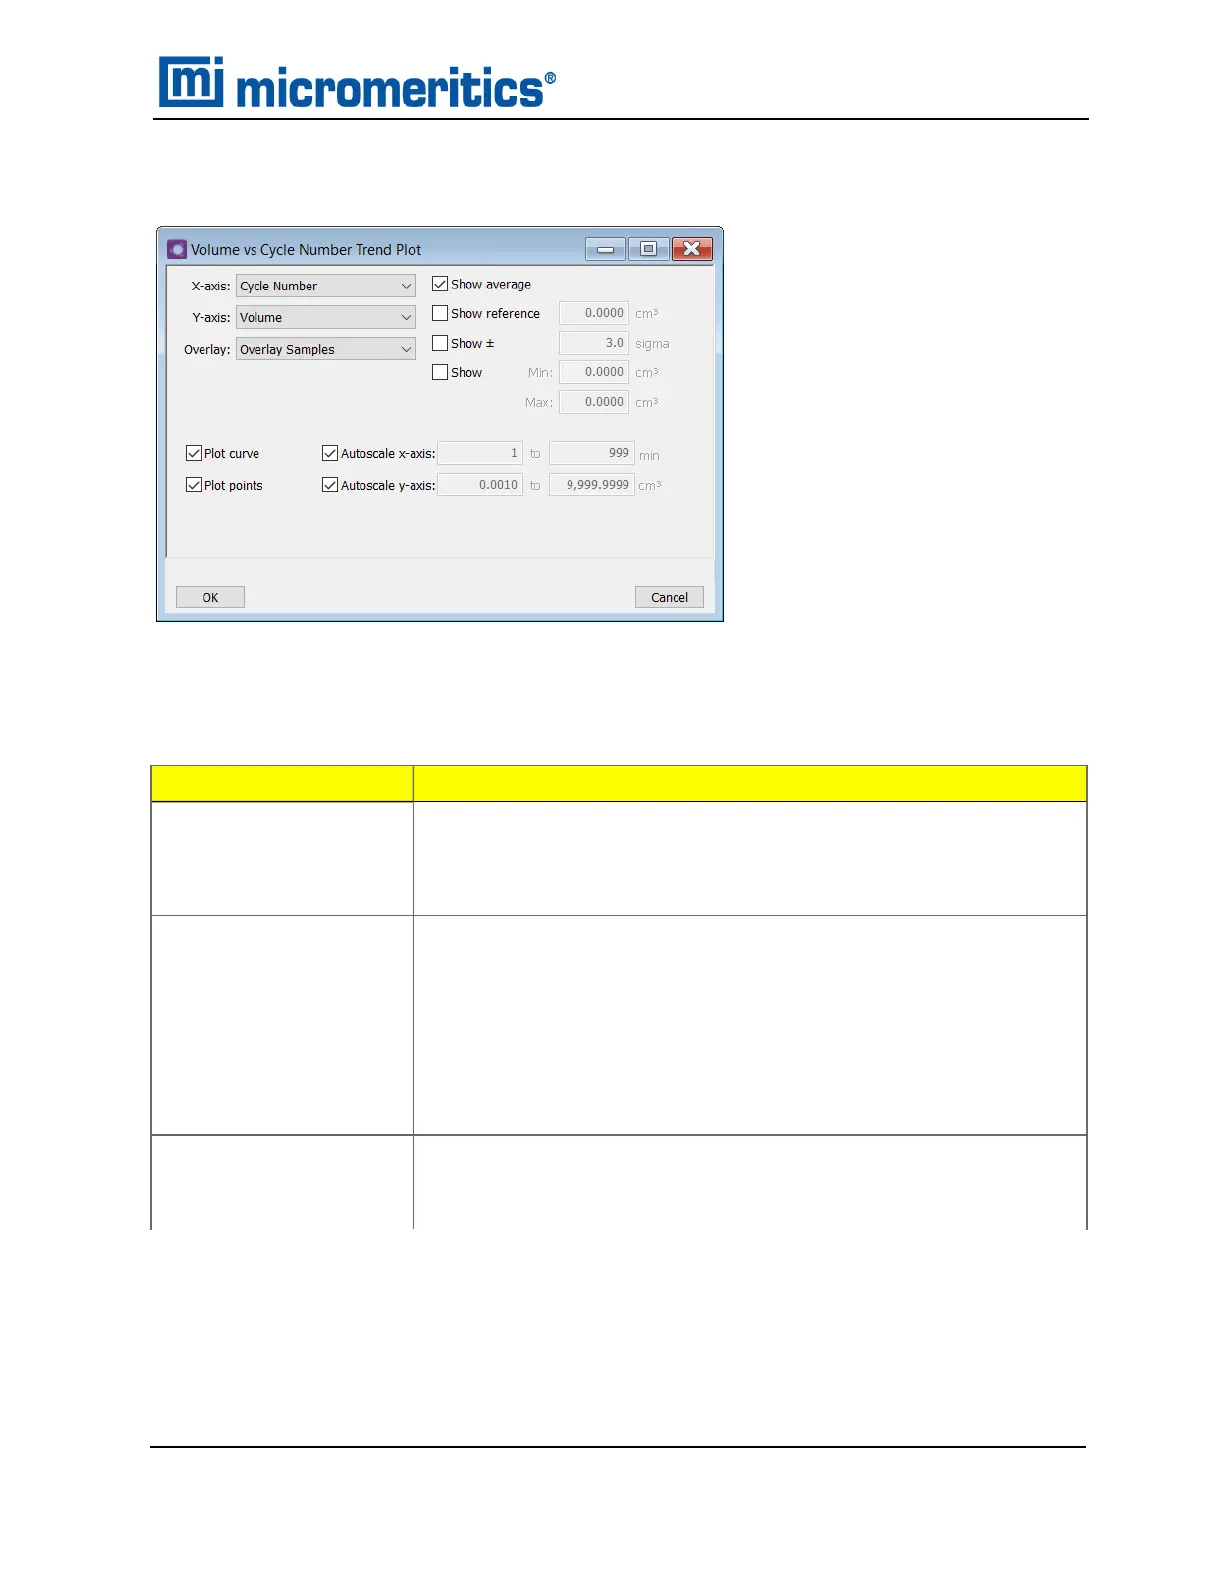
DENSITY VOLUME VS CYCLE NUMBER TREND PLOT
There are four types of graphical reports available. Report titles are based on the parameters
selected for the x-axis and y-axis.
Field or Button
Description
Autoscale x-axis
Autoscale y-axis
[checkbox]
When enabled on the report parameters windows, allows the x-and
y-axes to be scaled automatically. Autoscale means that the x-and
y-ranges will be set so that all the data is shown. If Autoscale is not
selected, the entered range is used.
Overlay [drop-downbox]
Select overlay plot options.
n A second y-axis can be selected to overlay with the variable in the y-
Axis field, or
n Select Overlay Samples to overlay data of the type selected in the y-
axis field with the same type of data contained in other sample files.
To select other sample files, go to the Report Options tab and click
the Overlays button.
Plot curve
Plot points
[checkbox]
Select to display how data are plotted.
Density Volume vs Cycle Number Trend Plot
Density Volume vs Cycle Number Trend Plot
AccuPyc II 1345 Operator Manual
134-42851-01 (Rev A) — Jan 2021
8 - 3
 Loading...


