Chapter 11 METER SETTING
11.2 System setup
132 HORIBA
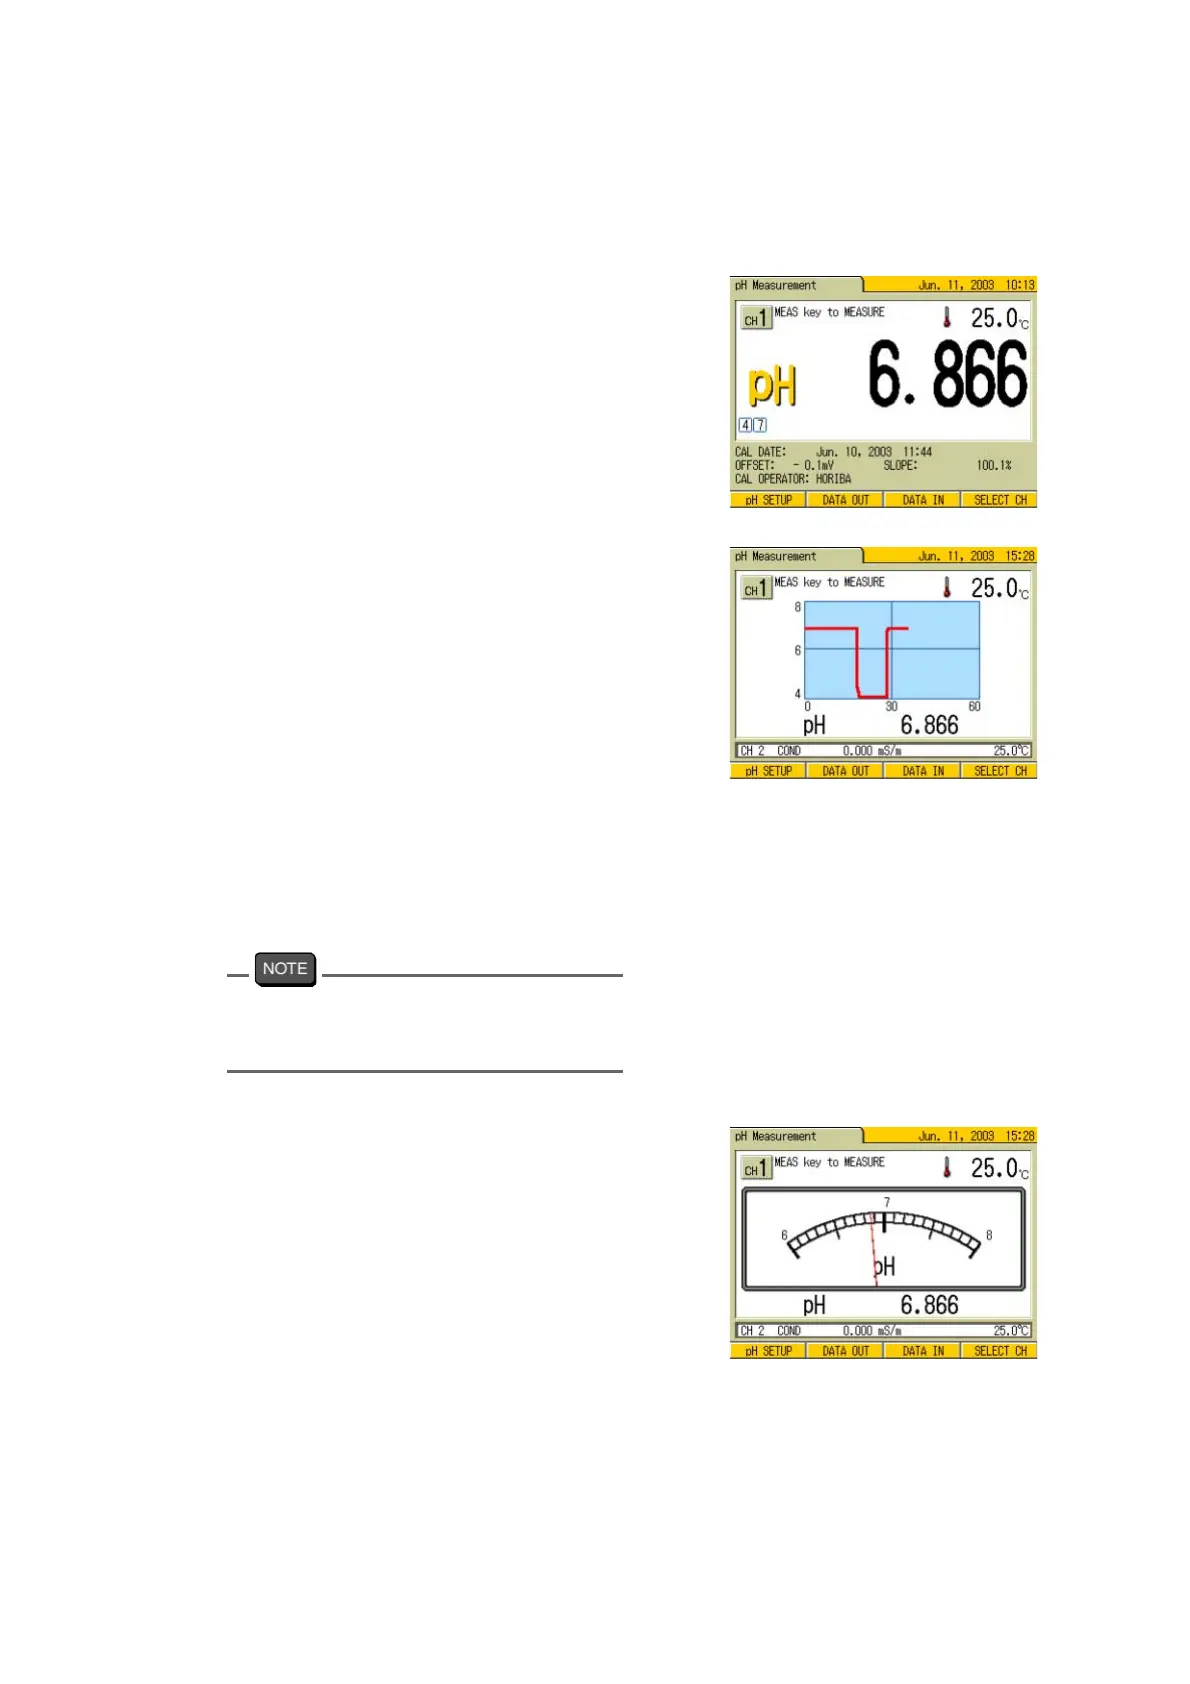
● Sample display of the Measurement screen
The sample display for each screen is as fol-
lows:
“DIGITAL” display
This is the standard screen display.
Screens are normally displayed in this pat-
tern (except for the Measurement screen).
“GRAPH” display
●
The display range is automatically
set.
●
The graph is cleared when the oper-
ations such as pressing MODE or
SETUP keys are made. The horizon
-
tal axis on the graph screen is
Instantaneous time (sec.).
●
The data is displayed as a graph in
measuring the instantaneous value
or in judging AutoHold.
●
Up to 180 seconds, the entire data is
displayed.
After 180 seconds, the data of the
latest 180 secs is displayed (maxi
-
mum up to 99999 seconds.).
The vertical range is set based on the maxi-
mum/minimum value from the start of mea-
surement.
“ANALOG” display
●
The display range is automatically
set.