23 Event Surveillance
302
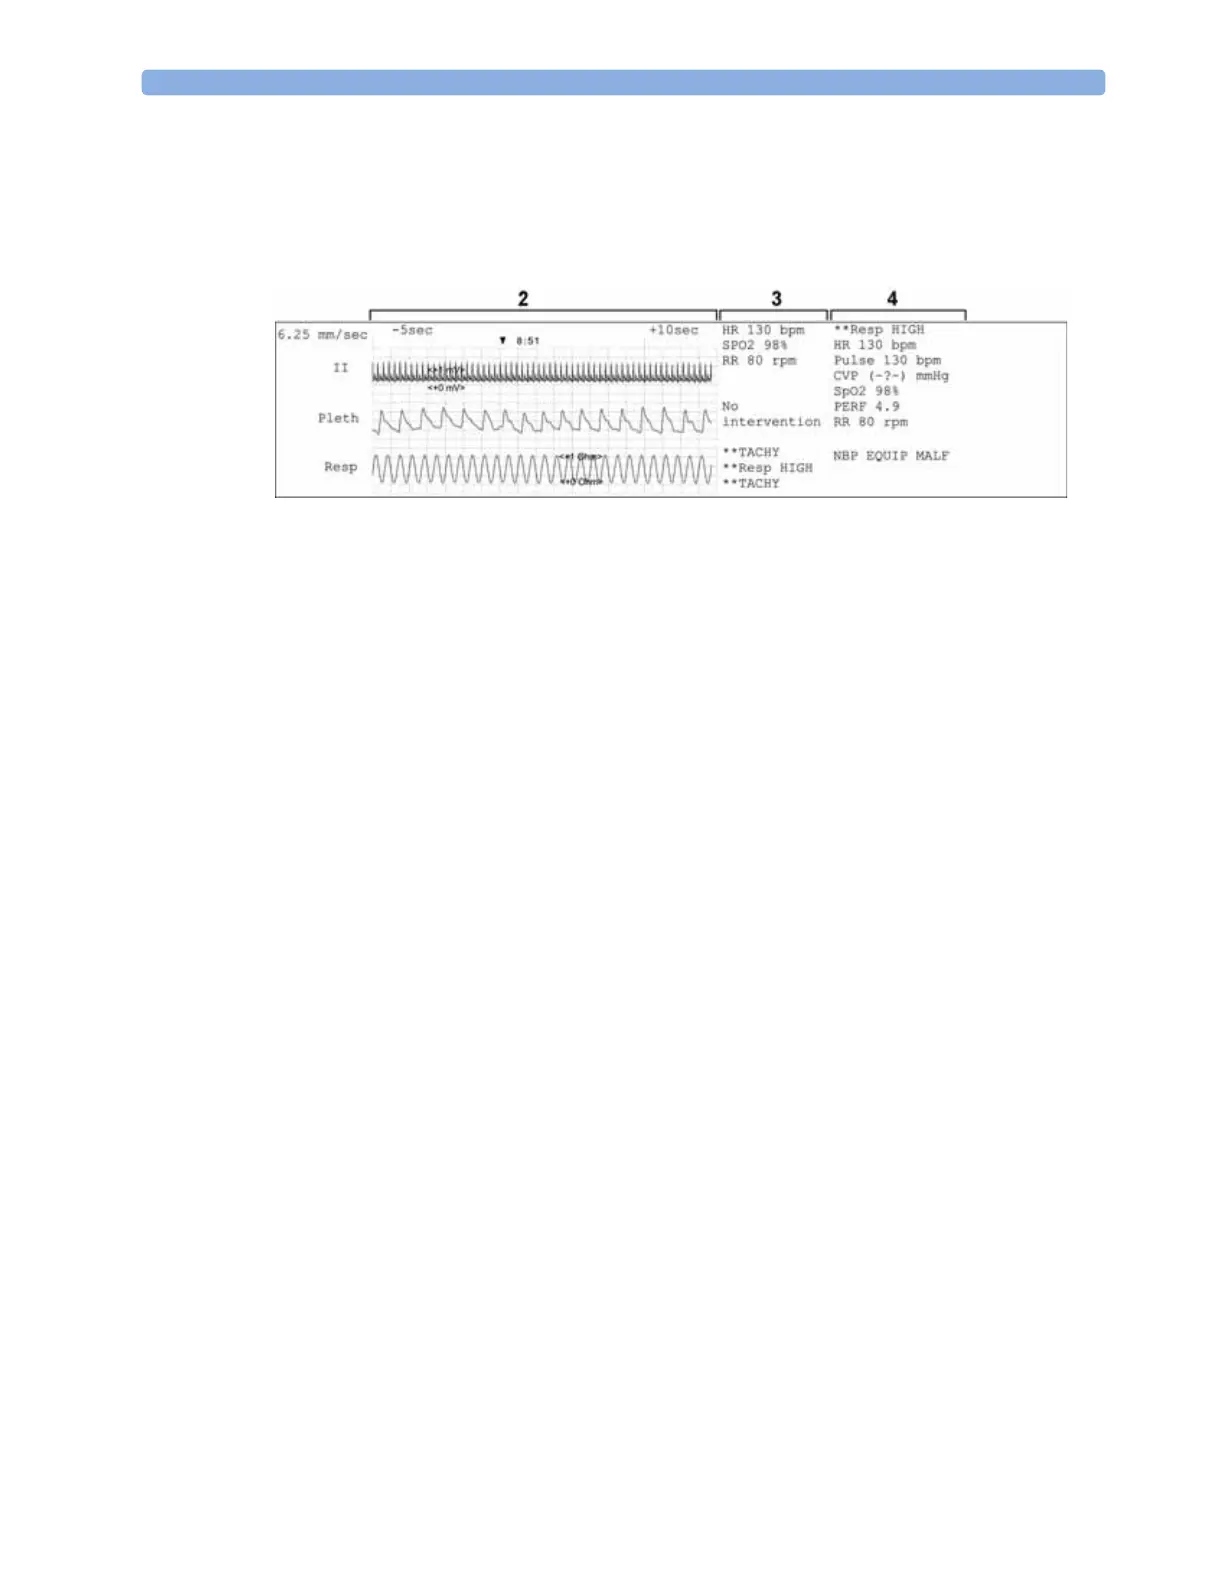
The second section (2 below) shows the waveforms recorded during the episode. The trigger moment
is marked with a triangle and divides the episode into the pre/post time. Any calibration marks and
grid marks on the screen are automatically printed on the recording.
If there are four measurements in the event group being recorded, two waveforms will be recorded in
two separate waveforms segments.
The third section (3 above) shows the most important vital signs information, including numerics,
active alarms, and any annotations made on the event episode.
The fourth section (4 above) shows the numerics for all the currently monitored vital signs and any
alarm conditions or INOPs active at the time the event was triggered.
Event Reports
Event reports can be printed on A4 and letter size paper on a printer connected locally or centrally to
your monitor.
Event Review Reports
The event review report documents all the events stored in the event database for a selected group.
 Loading...