Using the Toolbar Icons
ST80i Stress Test System Instructions for Use 2-19
Show Lead Map
Show Zoom ST
Show ST Map
Show Trend View (HR/METS; BP; ST Level)
Show Average
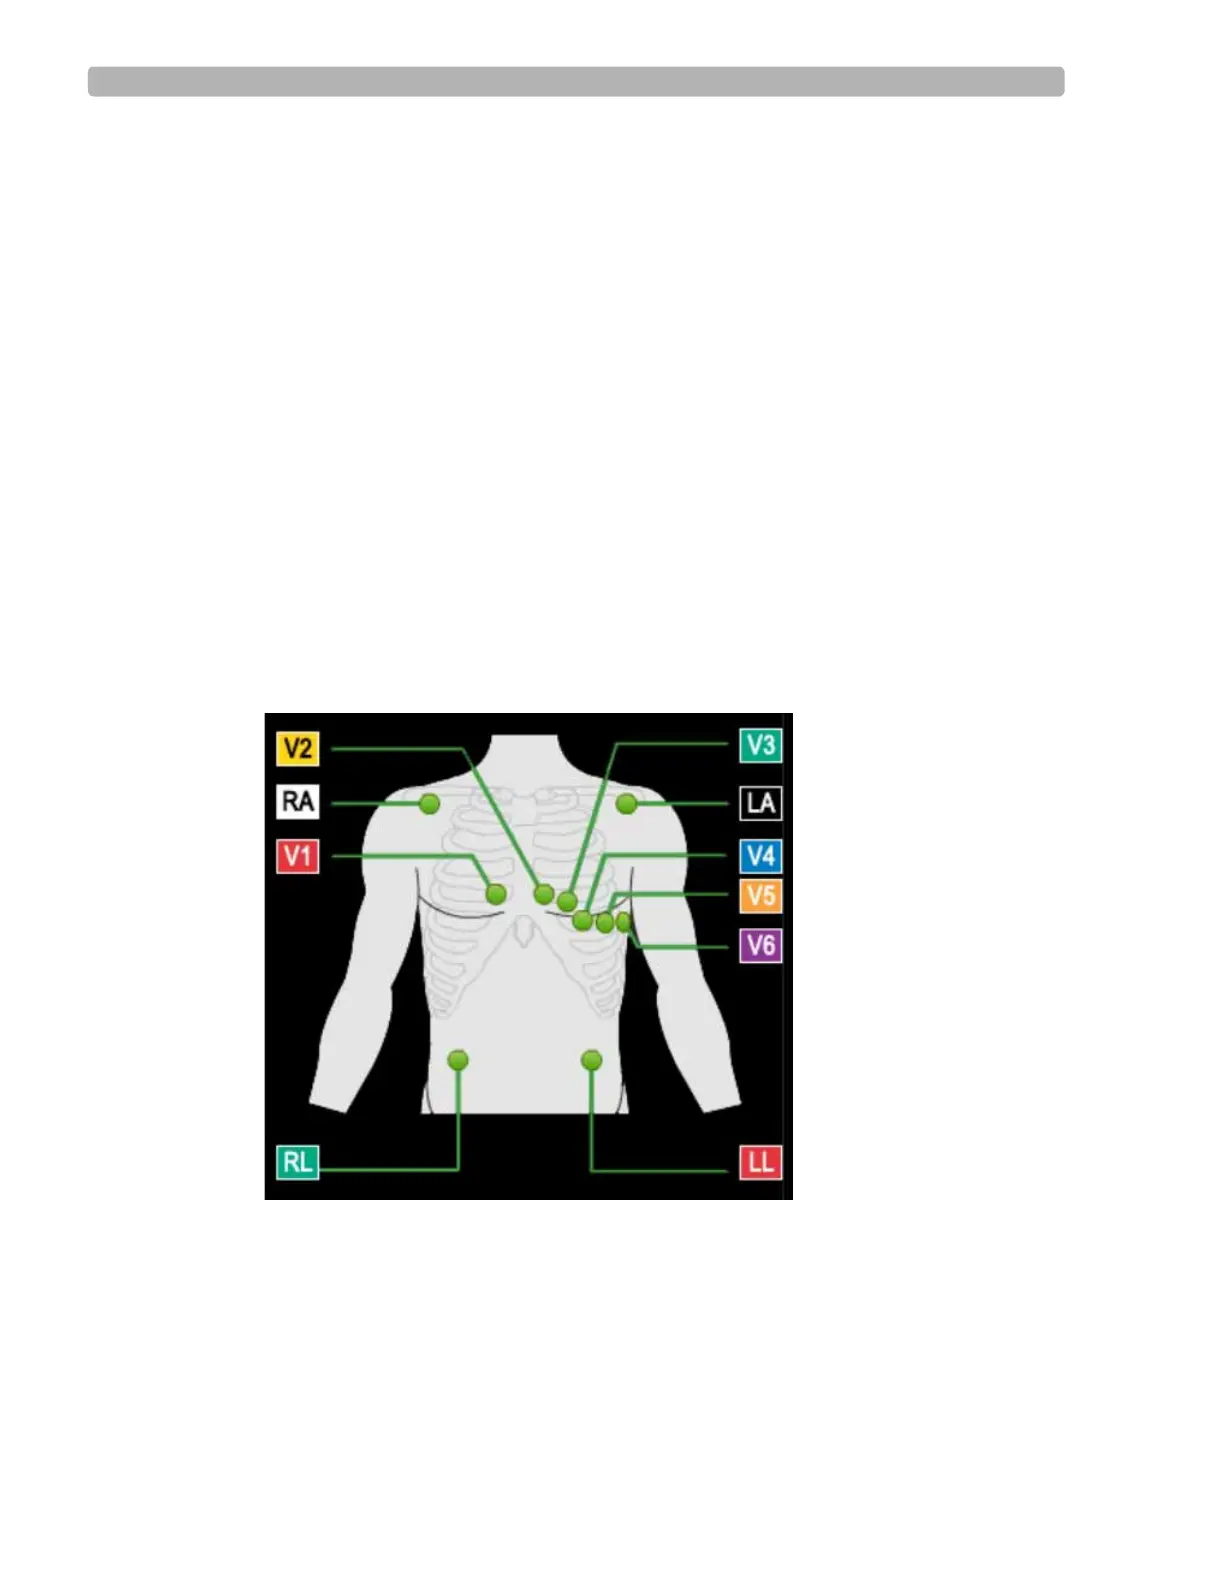
About the Lead Map
The Lead Map diagram shows the status of each lead. Yellow indicates lead-off, and green
indicates good contact.
To view the Lead Map
1
Click the Hide/Show View icon.
2 Select Show Lead Map.
The Lead Map appears in the top-right corner of the waveform.
All connections need to be green.
Figure 2-9 Lead Map Display
If a lead is off, a red “X” is displayed on the lead map and red, dashed flat line is displayed
in the real-time ECG view. On the PIM, this condition is verified by a yellow LED light.
3 To close the Lead Map, click the X in the upper-right corner.
NOTE When a leads-off condition is detected, the leads-off indicator string will be printed as a dashed line on
the report and the indicator will be saved when saving the report.