Using the Toolbar Icons
ST80i Stress Test System Instructions for Use 2-23
To view Trends
1
Click the Hide/Show View icon.
2 Select Show Trend View from the drop-down menu.
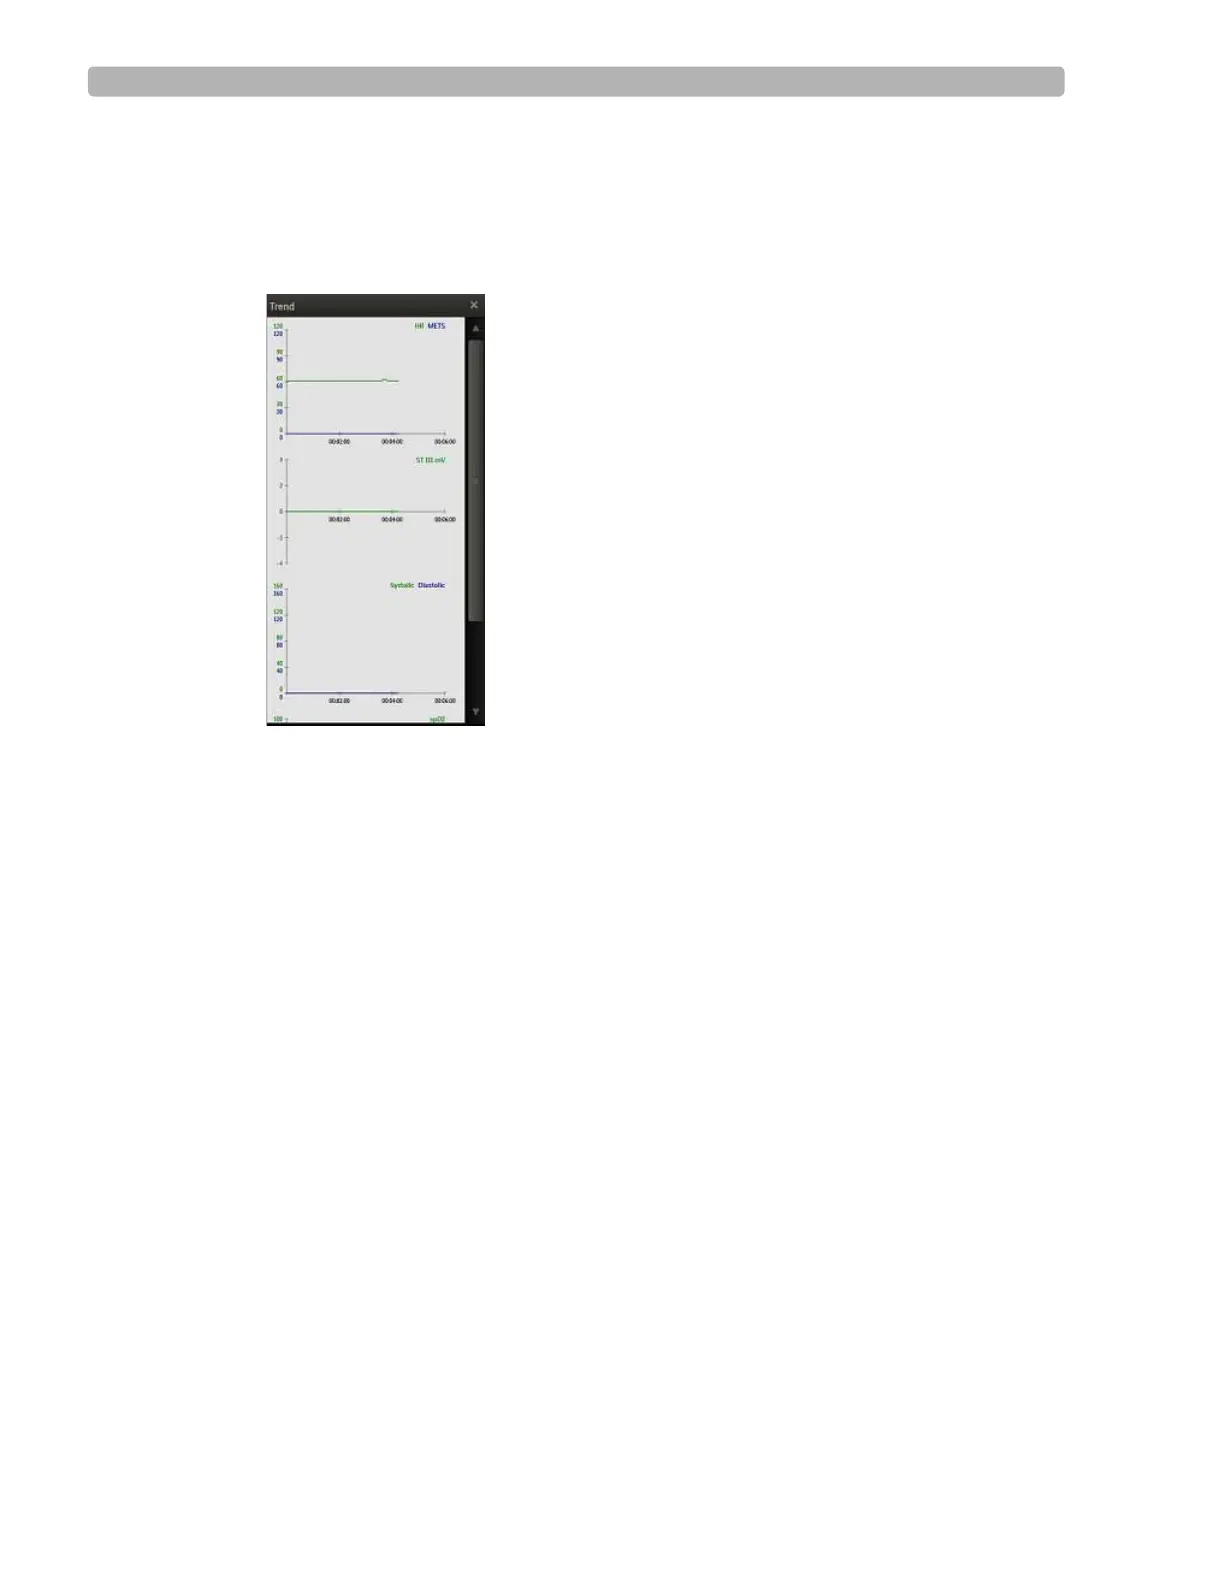
Figure 2-1 Show Trend View
The Trends View has three charts:
– HR/METS
– ST J + mV
– BP (Systolic, Diastolic)
3 Click the X to close the Show Trends view.
About HR/METS
This two-dimensional, color-coded chart is a visual indicator for both the current heart rate
and a dynamic change in heart rate. The chart’s X-axis represents time, and the HR value is
shown as a curve, representing the dynamic change over time. The Trend graphs of heart rate
can be viewed at any time.
METS refers to the estimated metabolic equivalents.
About ST J+ mV
The J-ST time interval is preconfigured in the user profile. This setting specifies the number of
milliseconds after the J-point that the ST value is measured. You cannot modify the J-ST time
interval during a patient session; it must be done in advance. To modify the J-ST time interval
in advance, see the ST80i Installation and Configuration Guide. You can, however, change the
J-point on the Report screen. See “Change (J+) Point” on page 4-7 for more information.
The ST-Amplitude calculation is absolute and is shown in mm.