An Overview of the ST80i Stress Test System
2-22 ST80i Stress Test System Instructions for Use
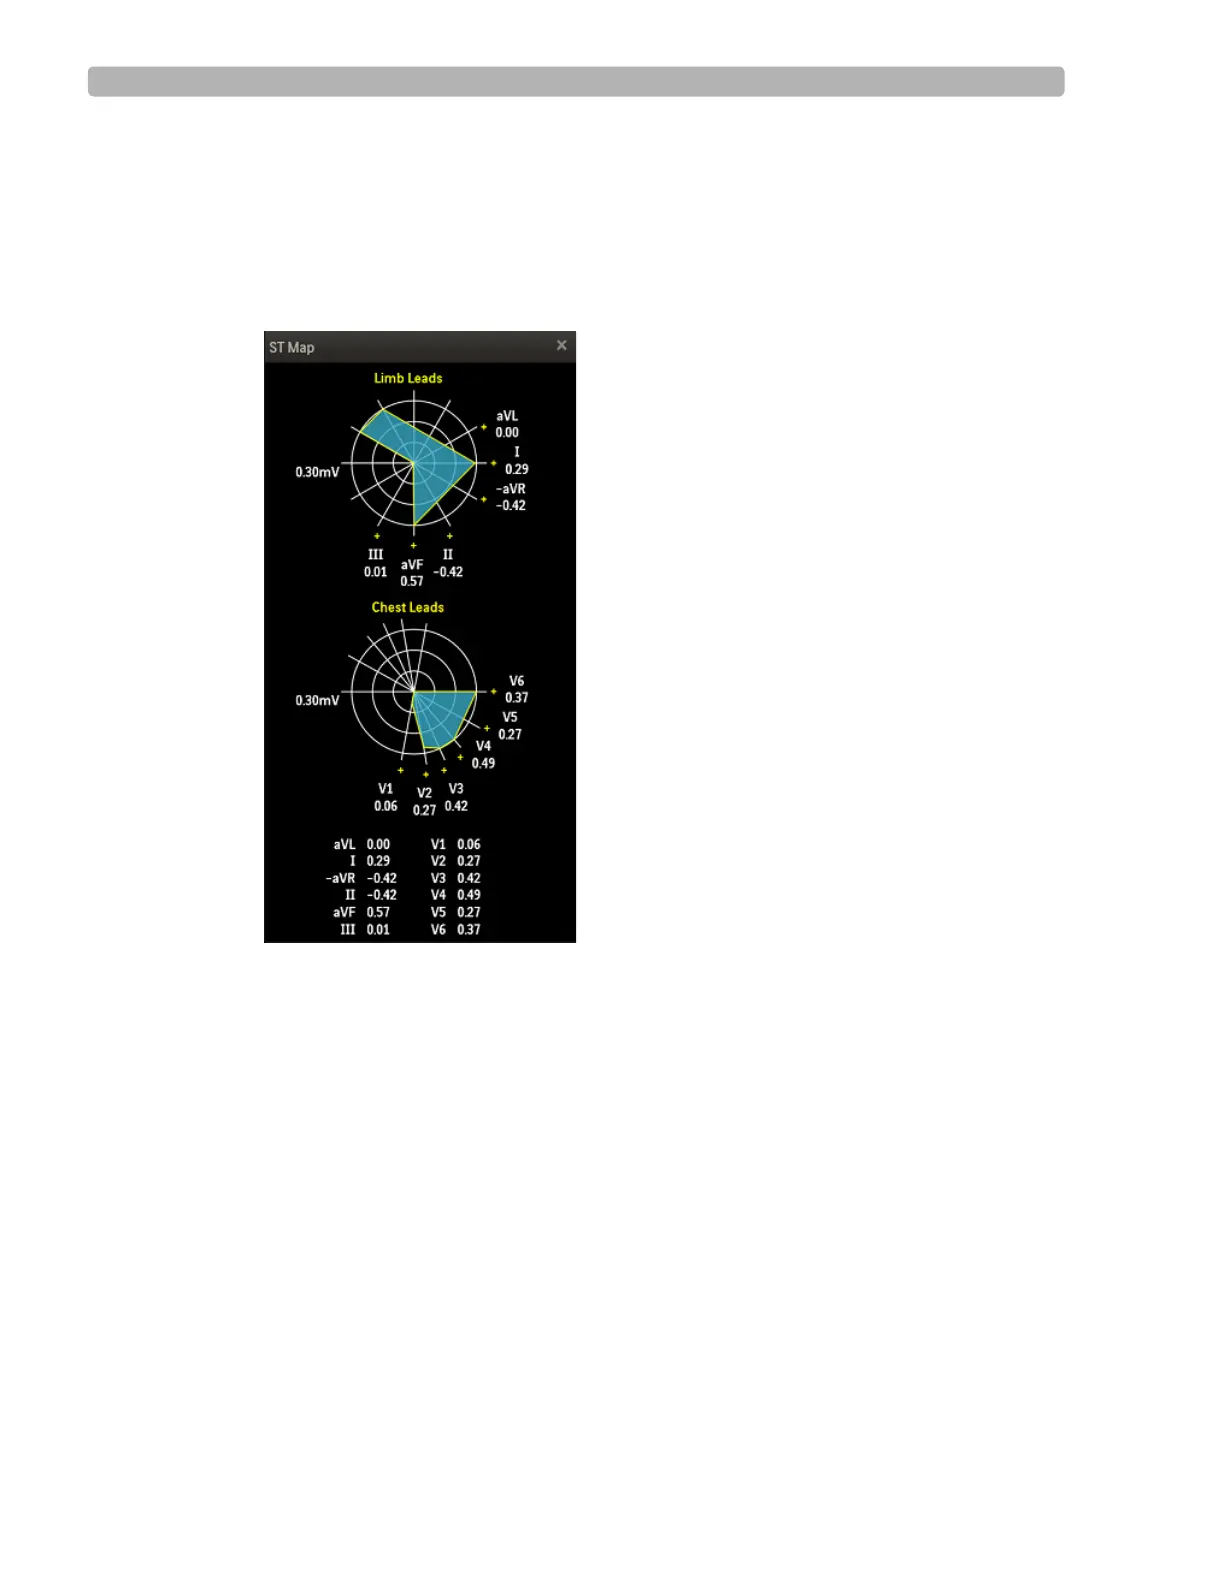
To view the ST Map
1
Click the Hide/Show View icon.
2 Select Show ST Map.
The ST Map displays on the waveform.
Figure 2-11 ST Map
3
Click the X in the upper-right corner to close the ST Map.
About Trend View
The Trends graphs show a visual indicator for the current heart rate as well as the dynamic
change in heart rate. The Trends data appears in 3 charts that can be viewed at any time.
NOTE Whichever lead is selected as the Zoom ST lead, the ST change trend for this lead is also displayed in
the Trend display.