Using the Toolbar Icons
ST80i Stress Test System Instructions for Use 2-21
To view the Zoomed ST Lead
1
Click the Hide/Show View icon.
2 Select Show Zoom ST.
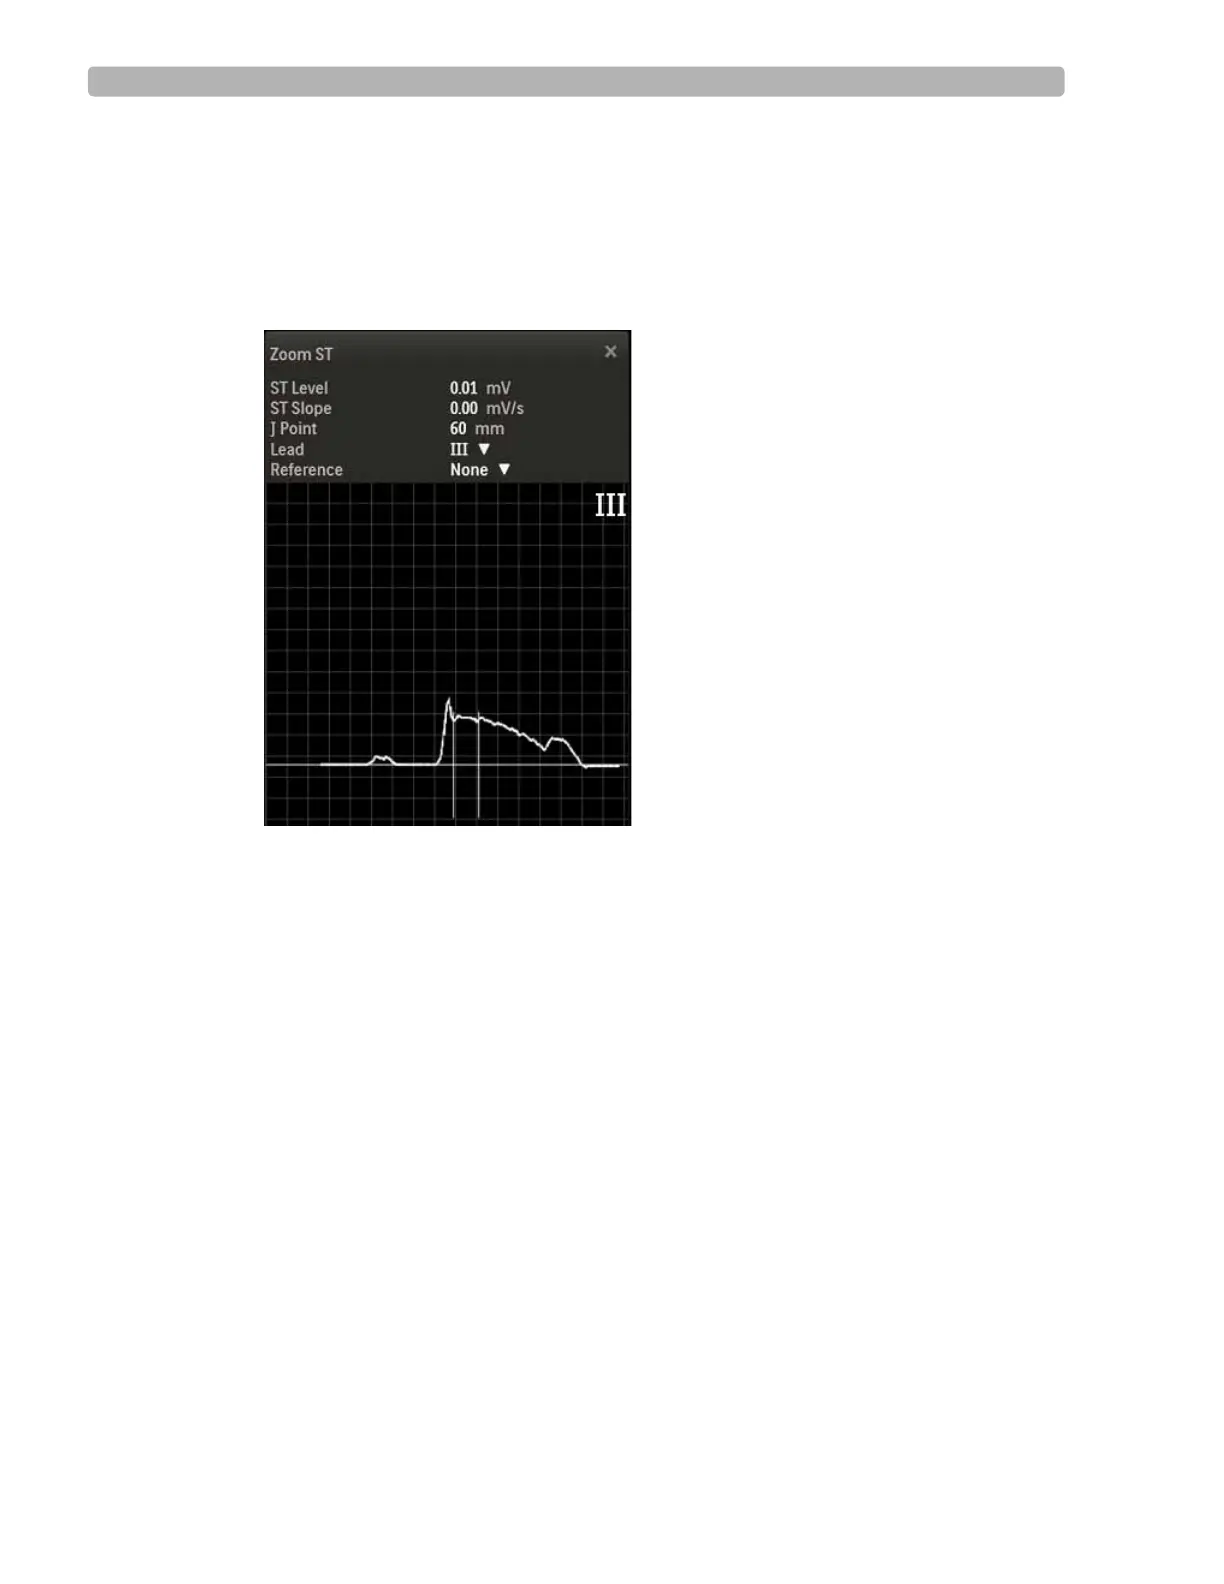
The default Zoom lead appears as one expanded average ECG complex on the waveform.
Figure 2-10 Zoom ST Display
3
To close, click the X in the upper-right corner.
To change the Zoomed ST Lead
1
Click the Hide/Show View icon.
2 Select Show Zoom ST
The default Zoom Lead name appears on the waveform.
3 Use the Lead drop-down menu to change to another Zoom Lead.
4 To close, click the X in the upper-right corner.
About the ST Map
The two-dimensional, color-coded ST map, which can help to identify ischemic areas in the
myocardium, is based on both the ST deviation and ST slope. It updates every 10 seconds and
can be displayed on the waveform screen.