84 PI-MAX/PI-MAX2 System Manual Version 5.F
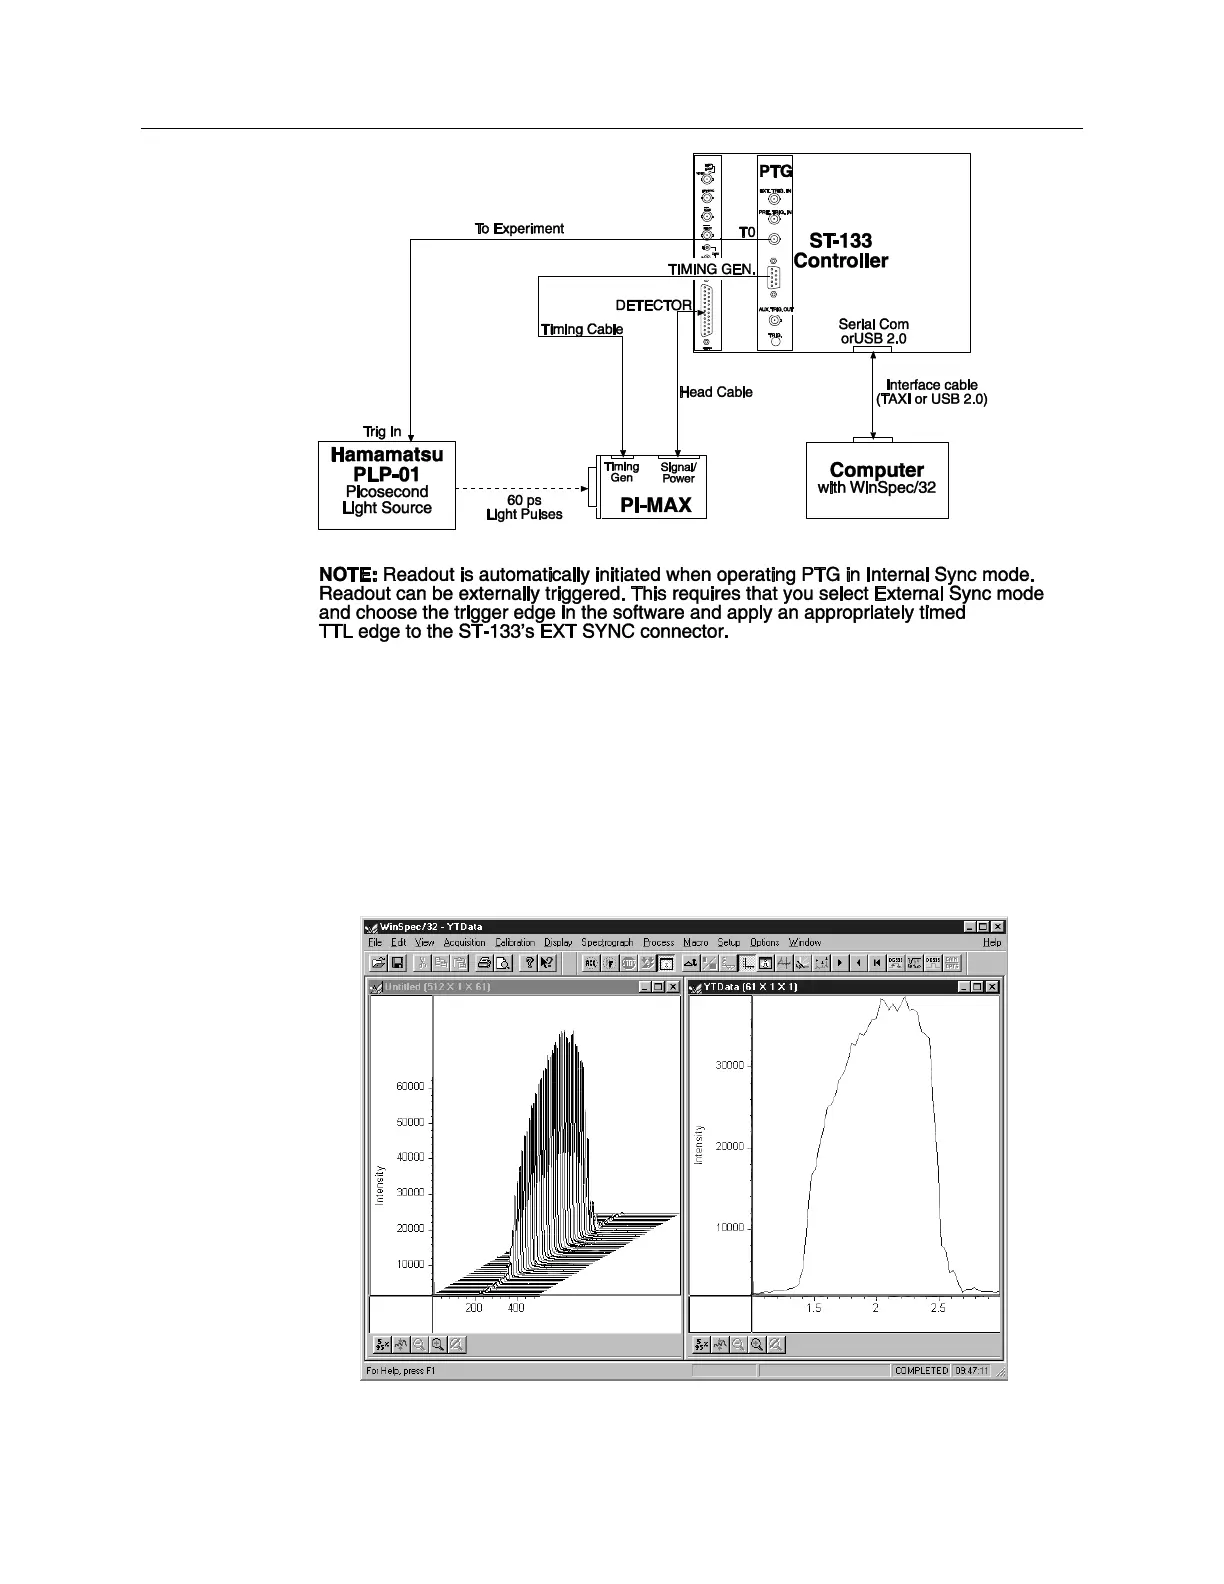
Figure 32. PTG Fast Gating Experiment Block diagram
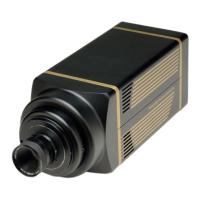
The WinSpec/32 software’s sequential gating function was used to increment the delay to
the PI-MAX gate in 50 ps steps. As a result, with respect to the applied light pulses, the
PI-MAX was gated 50 ps later with each repetition. The data from each pulse was
collected and displayed in a 3-D plot with time on the Z-axis. By sliding the coincidence
time of the gate and applied light pulses in this manner, a plot was produced that
accurately characterized the temporal profile of the PI-MAX fast gate function. The
measurement results are shown below. FWHM on the gate was 1.6 ns and the FW was
measured at 2 ns.
Figure 33. Fast Gating Measurement Results