7.2.3 Representation of the detection area
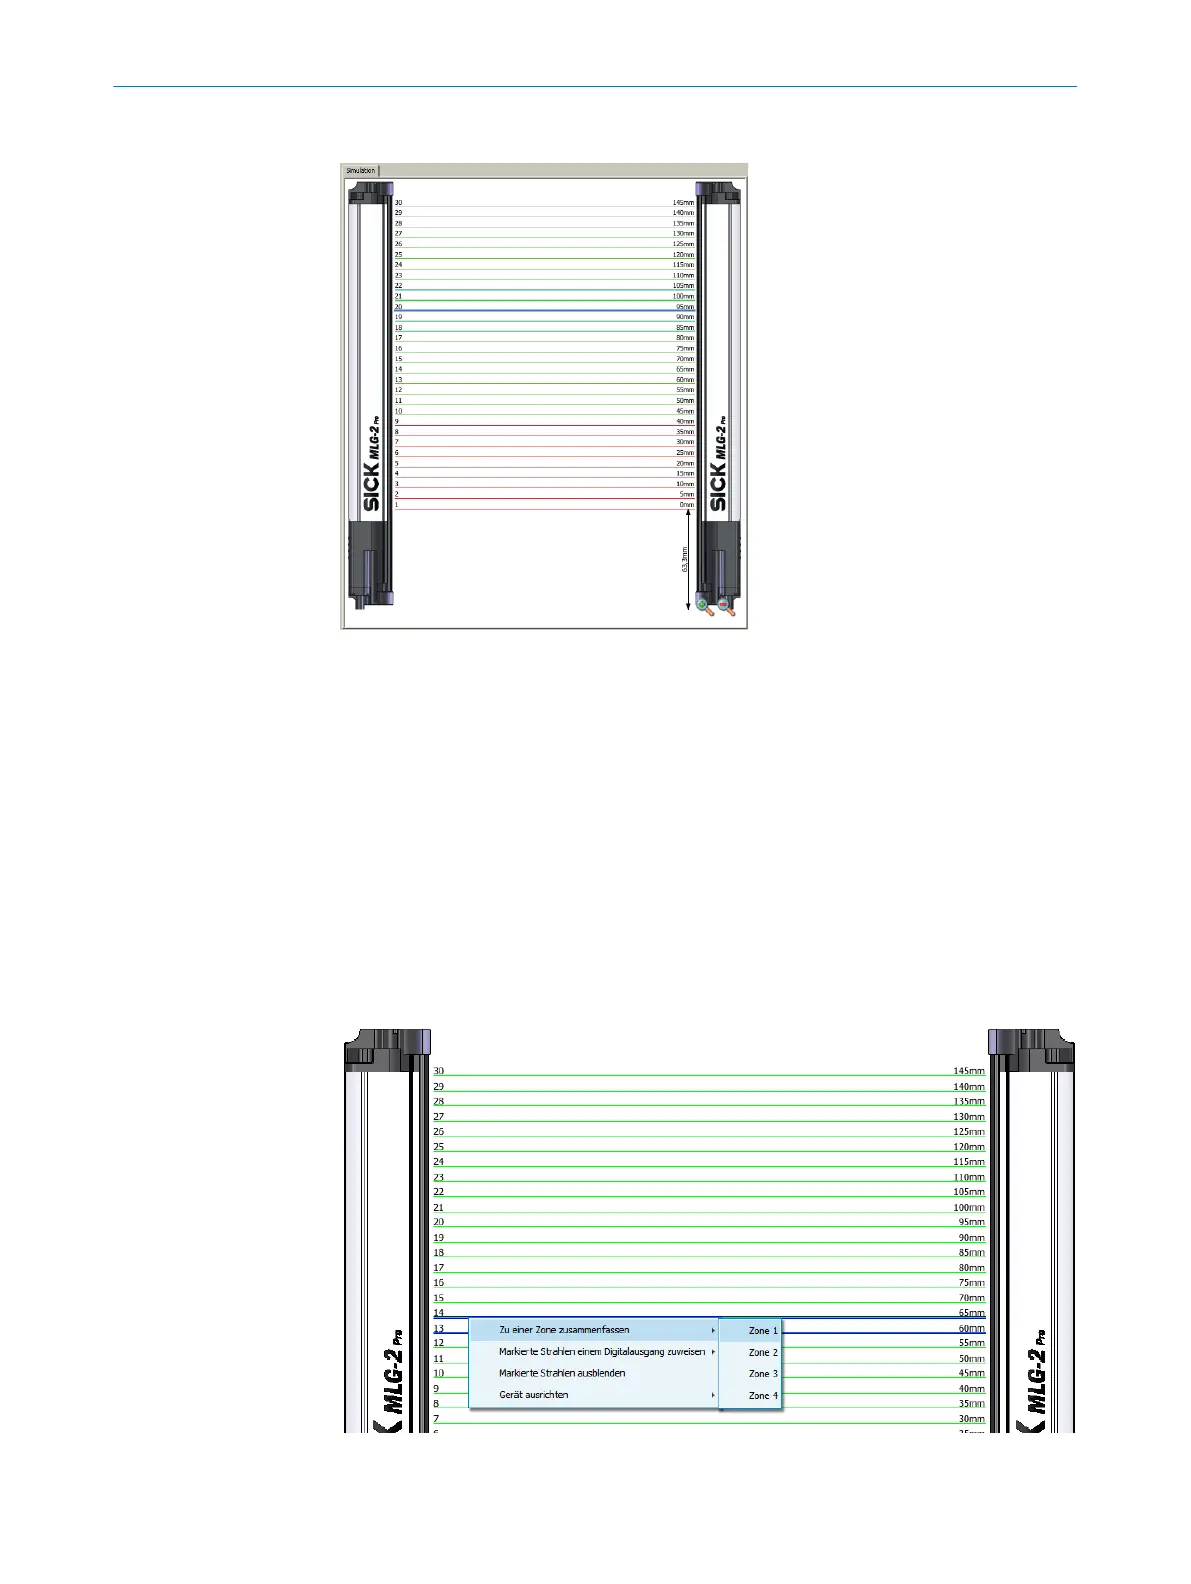
Figure 51: Detection area – Simulation
The central area of the SOPAS ET interface shows a simulation of the MLG-2 and its
beams:
•
Green = made beams
•
Red = Blocked beams
•
Gray = Blanked beams
•
Blue = Beams selected with the mouse
•
Turquoise = Configured tolerance
You can use the context menu to perform certain actions with the selected beams.
Context menu – Combining beams into zones
b
Select multiple consecutive beams.
b
In the context menu, select the command Combine to a zone > Zone X.
Figure 52: Combining beams into zones
CONFIGURATION WITH SOPAS ET 7
8017460.ZIK1/2017-02-13 | SICK O P E R A T I N G I N S T R U C T I O N S | MLG-2 Pro
59
Subject to change without notice