Control During Operation
7-18 7SA6 Manual
C53000-G1176-C133-1
The measured values are divided into the following groups:
01 2SHUDWLRQSUL Operational measured values, primary.
02 ,((SULPDU\ Measured values of earth fault, primary;
03 ,PSHGDQFH3ULP Operational impedance, primary;
04 6\QFKU&KHFNSUL Measured values of synchronism check, primary;
11 2SHUDWLRQVHF Operational measured values, secondary;
12 ,((VHFRQGDU\ Measured values of earth fault, secondary;
13 ,PSHGDQFH6HF Operational impedance, secondary ;
21 3HUFHQW Operational measured values, in percent of operational
nominal quantities;
31 'HPDQG Long-term average values, in primary values;
32 0LQ0D['HPDQG Minimum and maximum average values with date and time
indication of moment of occurrence, in primary values;
33 8,0LQ0D[ Minimum and maximum values of voltages and currents
with date and time indication of moment of occurrence, in
primary values;
34 SFRVϕ0LQ0D[ Minimum and maximum values of the actve, reactive and
apparent power of the frequence and the power factor;
41 7KHUPDO0HWHU Thermal measured values of the overload protection, if
available;
51 8VHU'HILQHG Measured values that are defined by the user during initial
setting of the device (see Section 5.2).
61 6HW3RLQWV See Subsubsection 7.1.3.2
71 6HWSRLQWV09 See Subsubsection 7.1.3.3
81 5HVHW See Subsubsection 7.1.3.4.
If a measured value is not available, then instead of the measured value, 3 dots
appear. If the value is undefined (e.g., cos ϕ, when no current is flowing), then “–––”
appears (3 horizontal bars). If a measured value overruns, then “
” (3 asterisks)
is displayed.
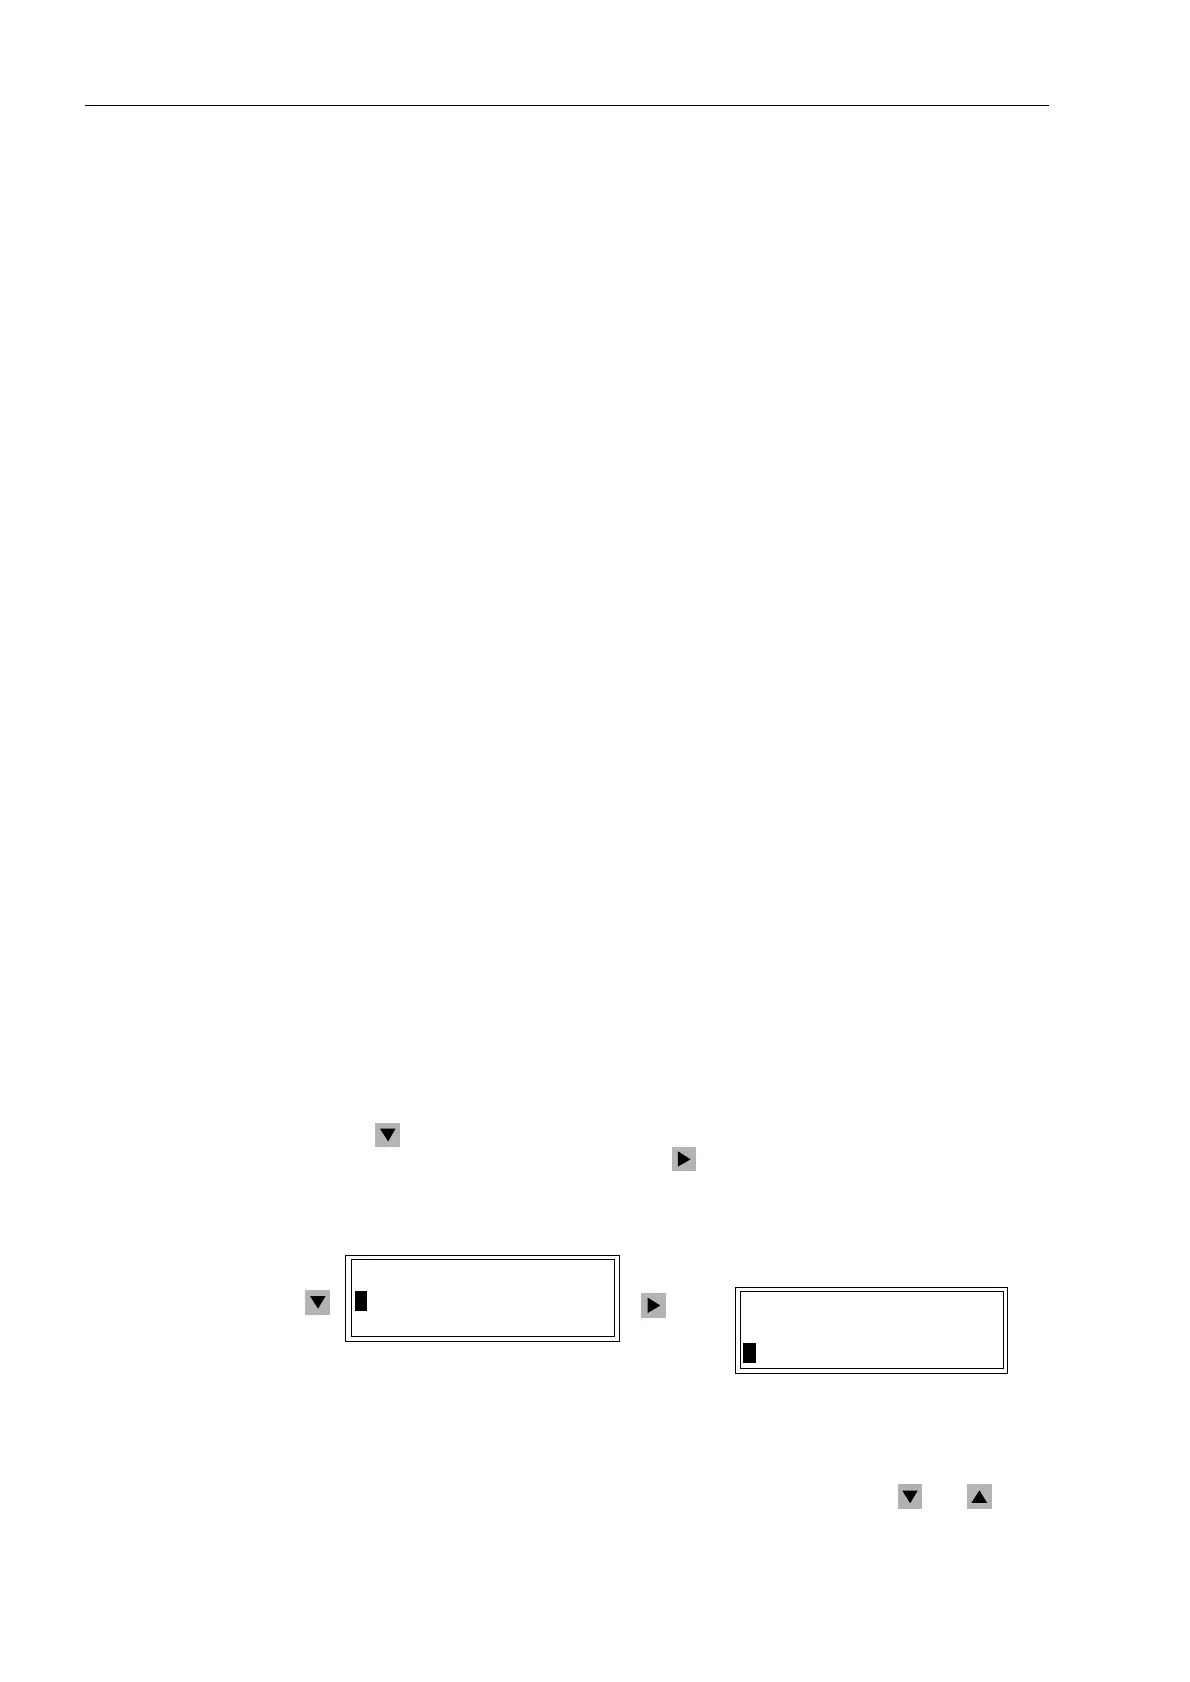
Use the key to select the measured value group that has the values desired, and
switch to the display of this group with the key. Figure 7-20 shows an example for
the display of operating measured values.
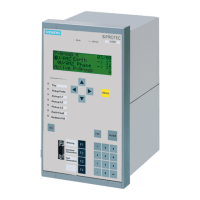
Figure 7-20 Viewing operating measured values on the front display
Move up and down in the table of measured value groups using the and keys.
0($685(0(17
!2SHUDWLRQSUL
!2SHUDWLRQVHF
23(5$7,2135,
!,/ $
!,/ $
Etc.
Etc.
 Loading...