Scope Multimeter Capturing Data
97
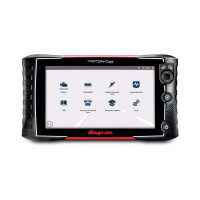
Display Full Scale - displays the value of the entire (full) scale
Example (Figure 9-32): If the vertical scale is set to 1V, the value displayed is
1V.
Figure 9-32
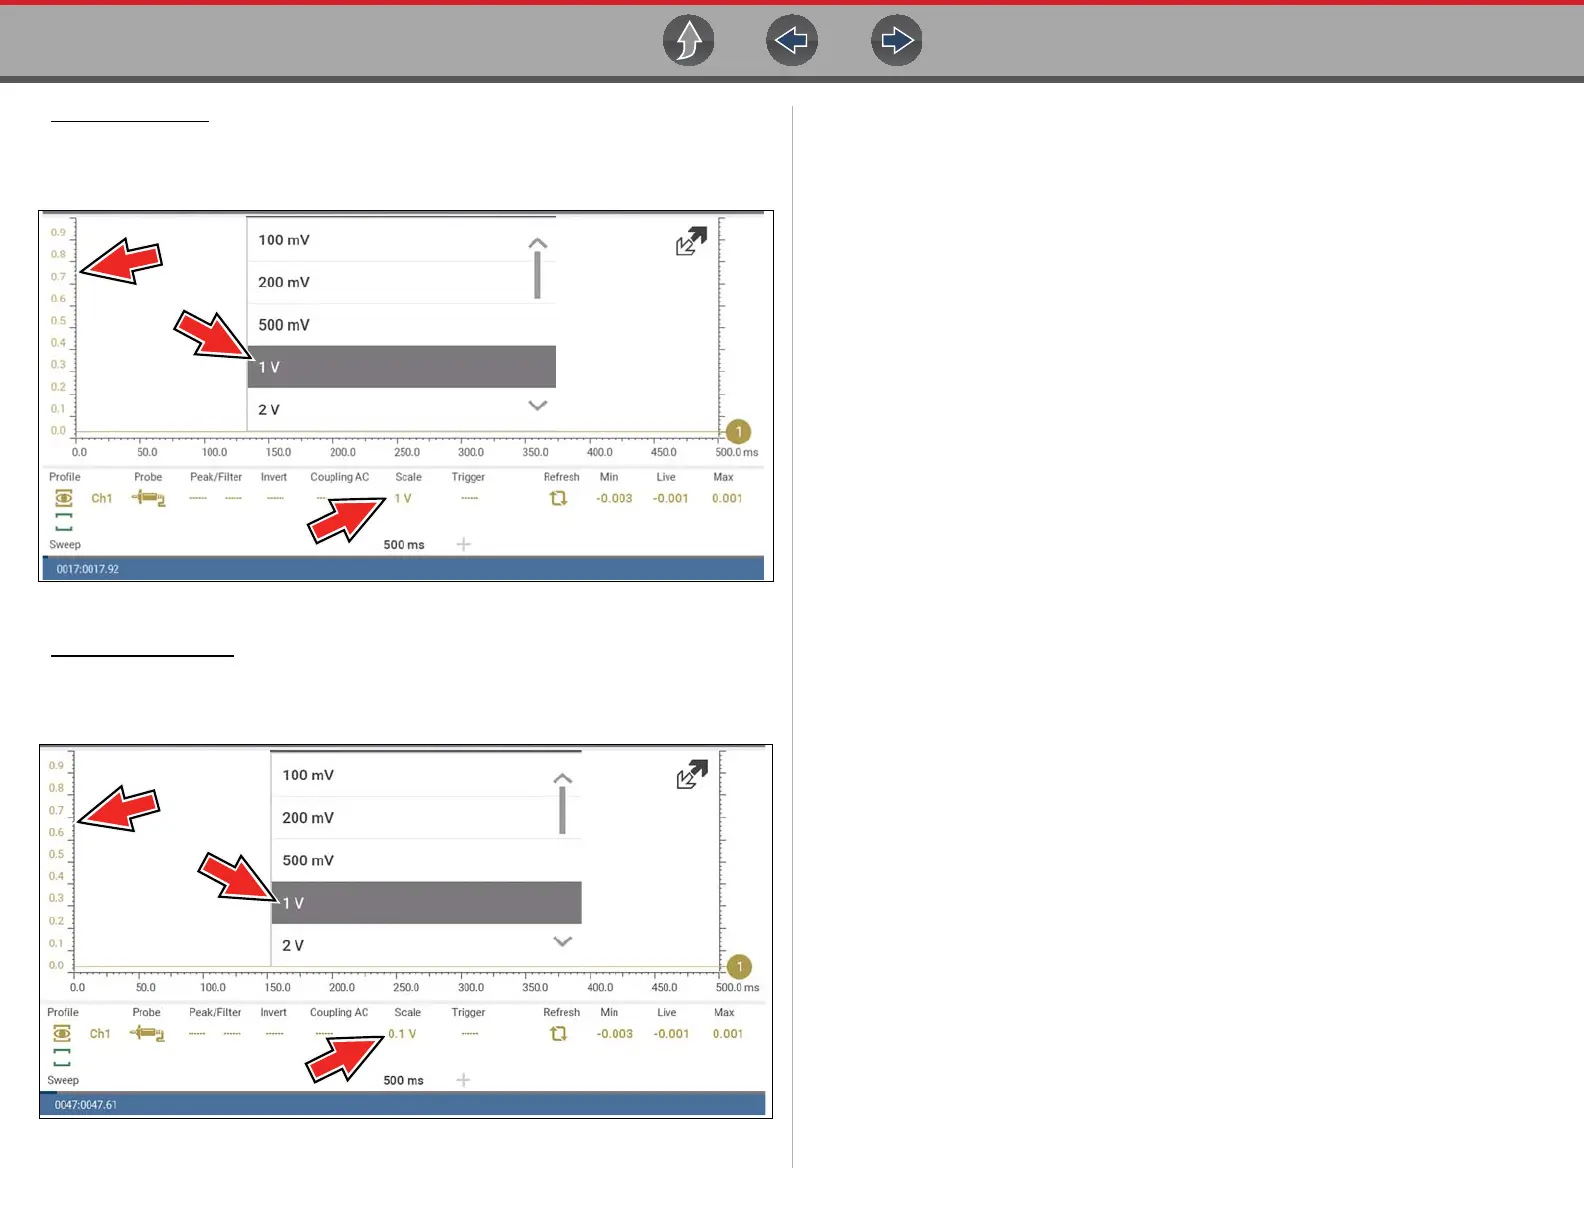
Display Per Division - displays the graduation value of the major scale divisions
Example (Figure 9-33): If the vertical scale is set to 1V, the value displayed is
0.1V.
Figure 9-33
9.8 Capturing Data
The primary purpose and advantage of the Lab Scope and Graphing Multimeter, is
their ability to capture, store and playback data (test signals). Having this ability can
be invaluable when diagnosing intermittent issues, by providing you the ability to
navigate through the data in detail to find events of interest, such as glitches and
signal losses. The following sections describe the basics of the data buffer and the
two basic modes of operation, Capture Mode and Review Mode.
9.8.1 About the Data Buffer
To gain a better understanding of the capabilities of the scope and the basics of
capturing and reviewing data, understanding what the data buffer is and how it
works is important.
The Lab Scope and Graphing Multimeter have the capability to capture, store and
playback data (test signals) utilizing internal buffer storage memory. When a test
function is selected (e.g. Lab Scope > DC Volts), the data is automatically stored in
buffer memory, until the Pause icon is selected.
The amount of data you can capture is limited to a predetermined “total buffer
memory” size. When the buffer memory reaches its full capacity, the data buffer will
continue to store new data, however earlier stored data will be removed to allow
room for the new data being stored. The most recent data is always available for
review when the scope is paused, and can be reviewed using the toolbar controls
As a visual aid, a graphic Data Buffer Slider (Figure 9-34 (1)) is located at the
bottom of the screen and indicates the position of the current displayed frame of
data in relation to the entire buffer memory capacity.
In addition, a Data Buffer Position Counter (Figure 9-34 (2)) displays the numerical
position of the Data Buffer Slider within buffer memory.
 Loading...