Previews 112
Tables
TablesTables
Tables
Evaluate the function y=x
3
N2x at each integer between M10 and 10. How many sign
changes are there, and where do they occur?
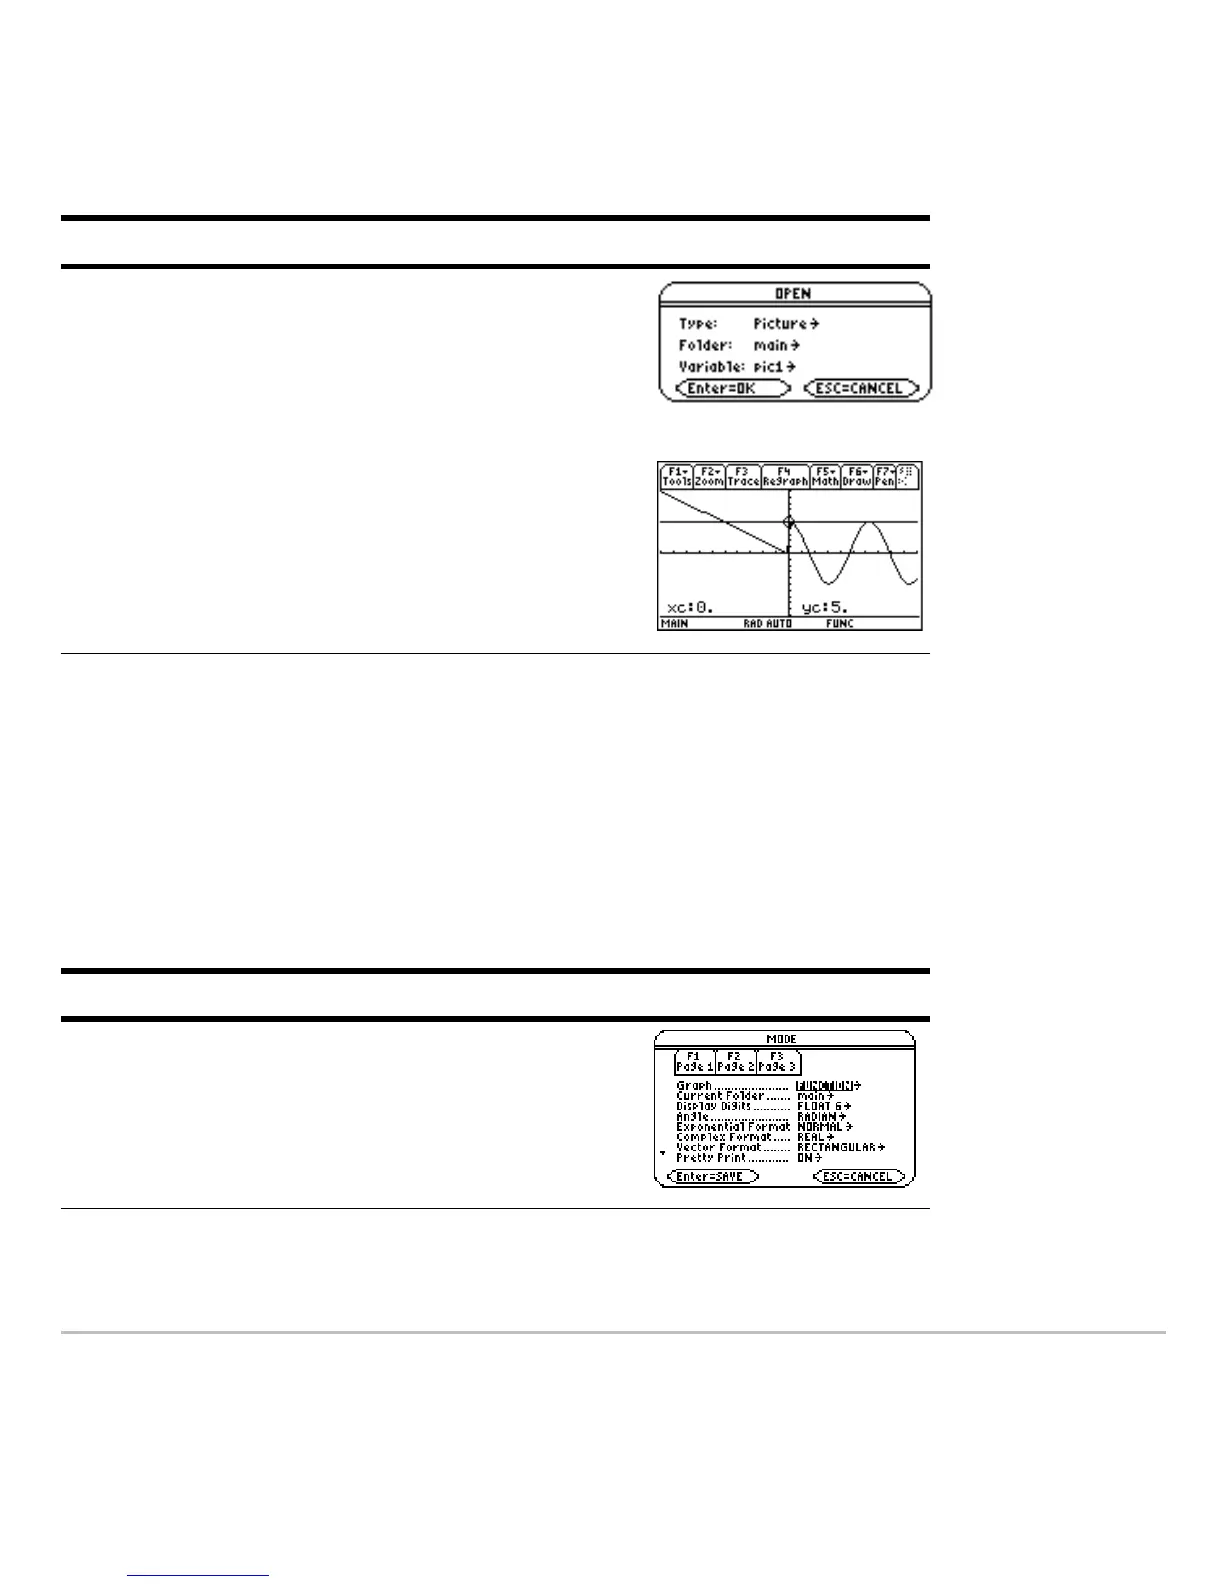
7. Open the saved picture variable to
redisplay the graph with the line.
Be sure to set
Type = Picture. By default, it
is set to
GDB.
Press , 1 B 2 (if not already shown,
also set Variable = pic1) ¸
Steps and keystrokes Display
1. Display the MODE dialog box. For the
Graph mode, select FUNCTION.
Press 3 B 1 ¸
Steps and keystrokes Display