Statistics and Data Plots 554
• Execute a Graph command.
• Open a different variable in the Data/Matrix Editor.
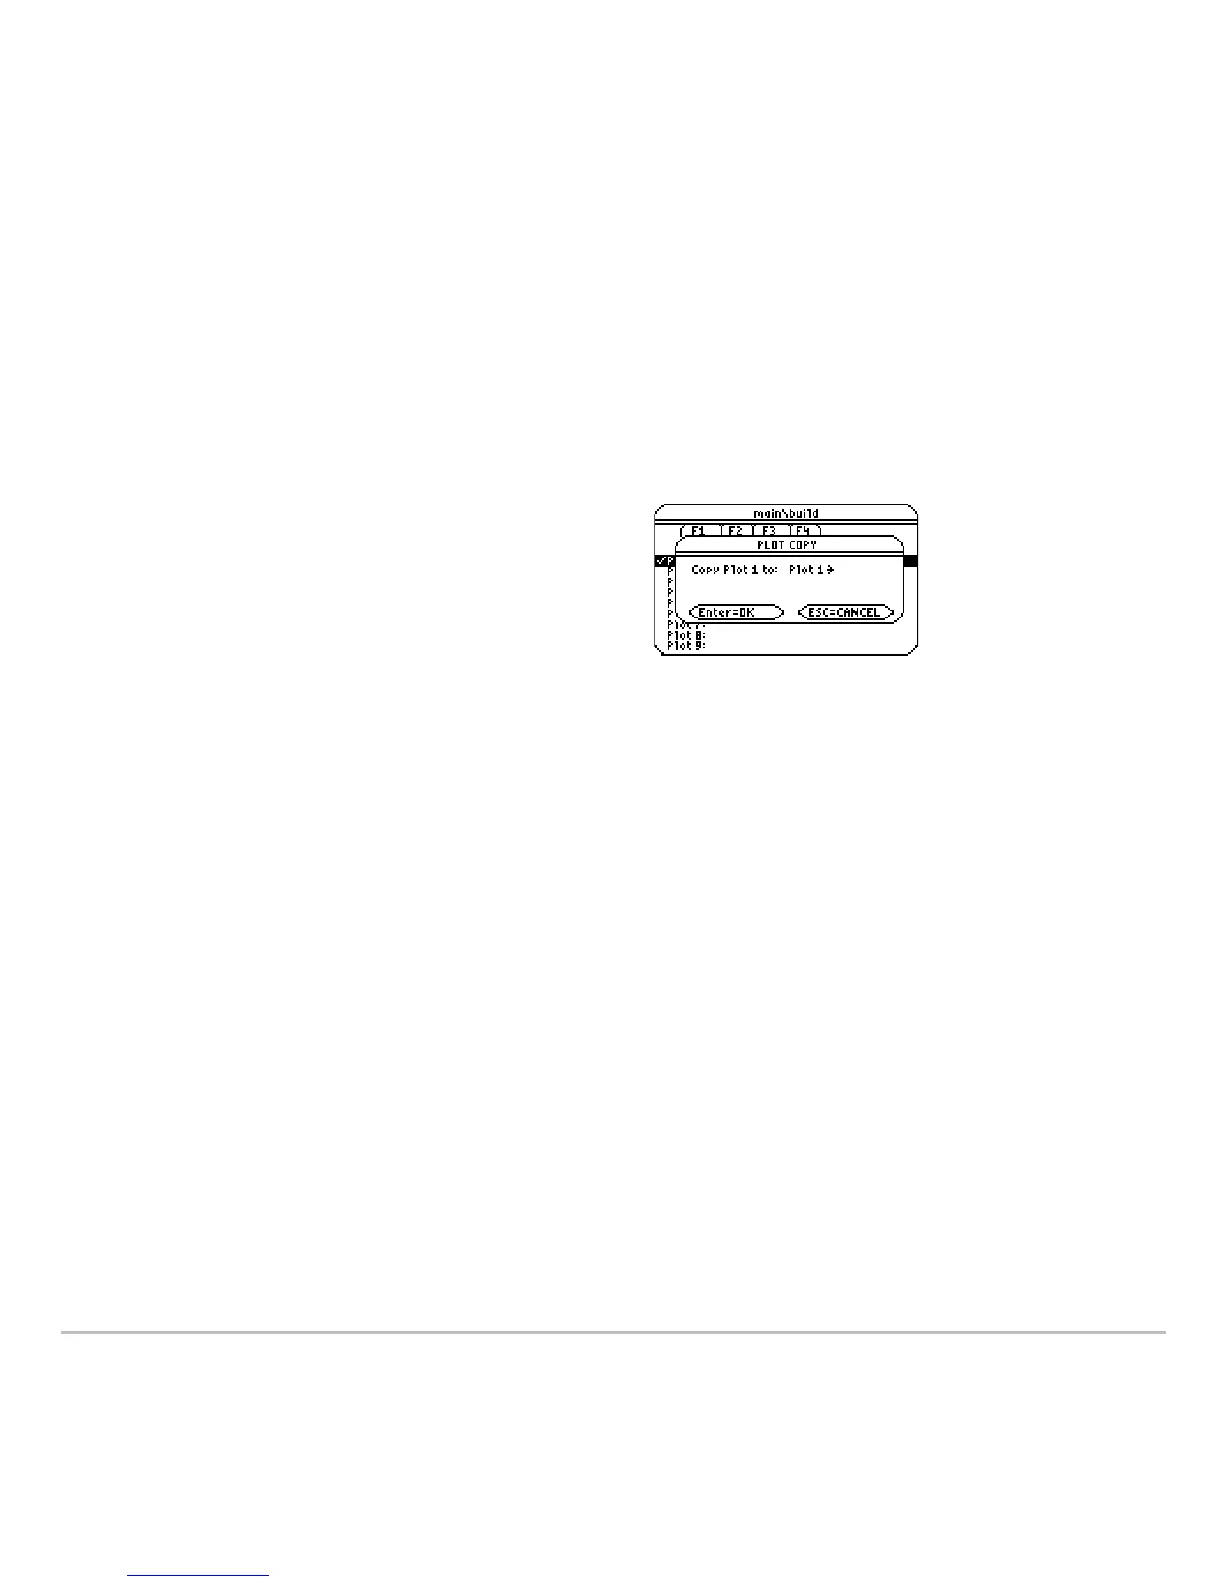
Copying a Plot Definition
Copying a Plot DefinitionCopying a Plot Definition
Copying a Plot Definition
From
Plot Setup:
Note: If the original plot was selected (Ÿ), the copy is also selected.
Clearing a Plot Definition
Clearing a Plot DefinitionClearing a Plot Definition
Clearing a Plot Definition
From Plot Setup, highlight the plot and press …. To redefine an existing plot, you do not
necessarily need to clear it first; you can make changes to the existing definition. To
prevent a plot from graphing, you can deselect it.
Statistical Plot Types
Statistical Plot TypesStatistical Plot Types
Statistical Plot Types
When you define a plot as described in the previous section, the Plot Setup screen lets
you select the plot type. This section gives more information about the available plot
types.
1. Highlight the plot and press „.
2. Press B and select the plot number that
you want to copy to.
3. Press ¸.