EasyManuals Logo

Texas Instruments Titanium TI-89 User Manual

Texas Instruments Titanium TI-89
1008 pages
To Next Page IconTo Next Page
To Previous Page IconTo Previous Page
Page #303 background image
Basic Function Graphing 303
Exploring the Graph
Exploring the GraphExploring the Graph
Exploring the Graph
From the Graph screen, you can:
Display the coordinates of any pixel by using the free-moving cursor, or of a plotted
point by tracing a function.
•Use the
Zoom toolbar menu to zoom in or out on a portion of the graph.
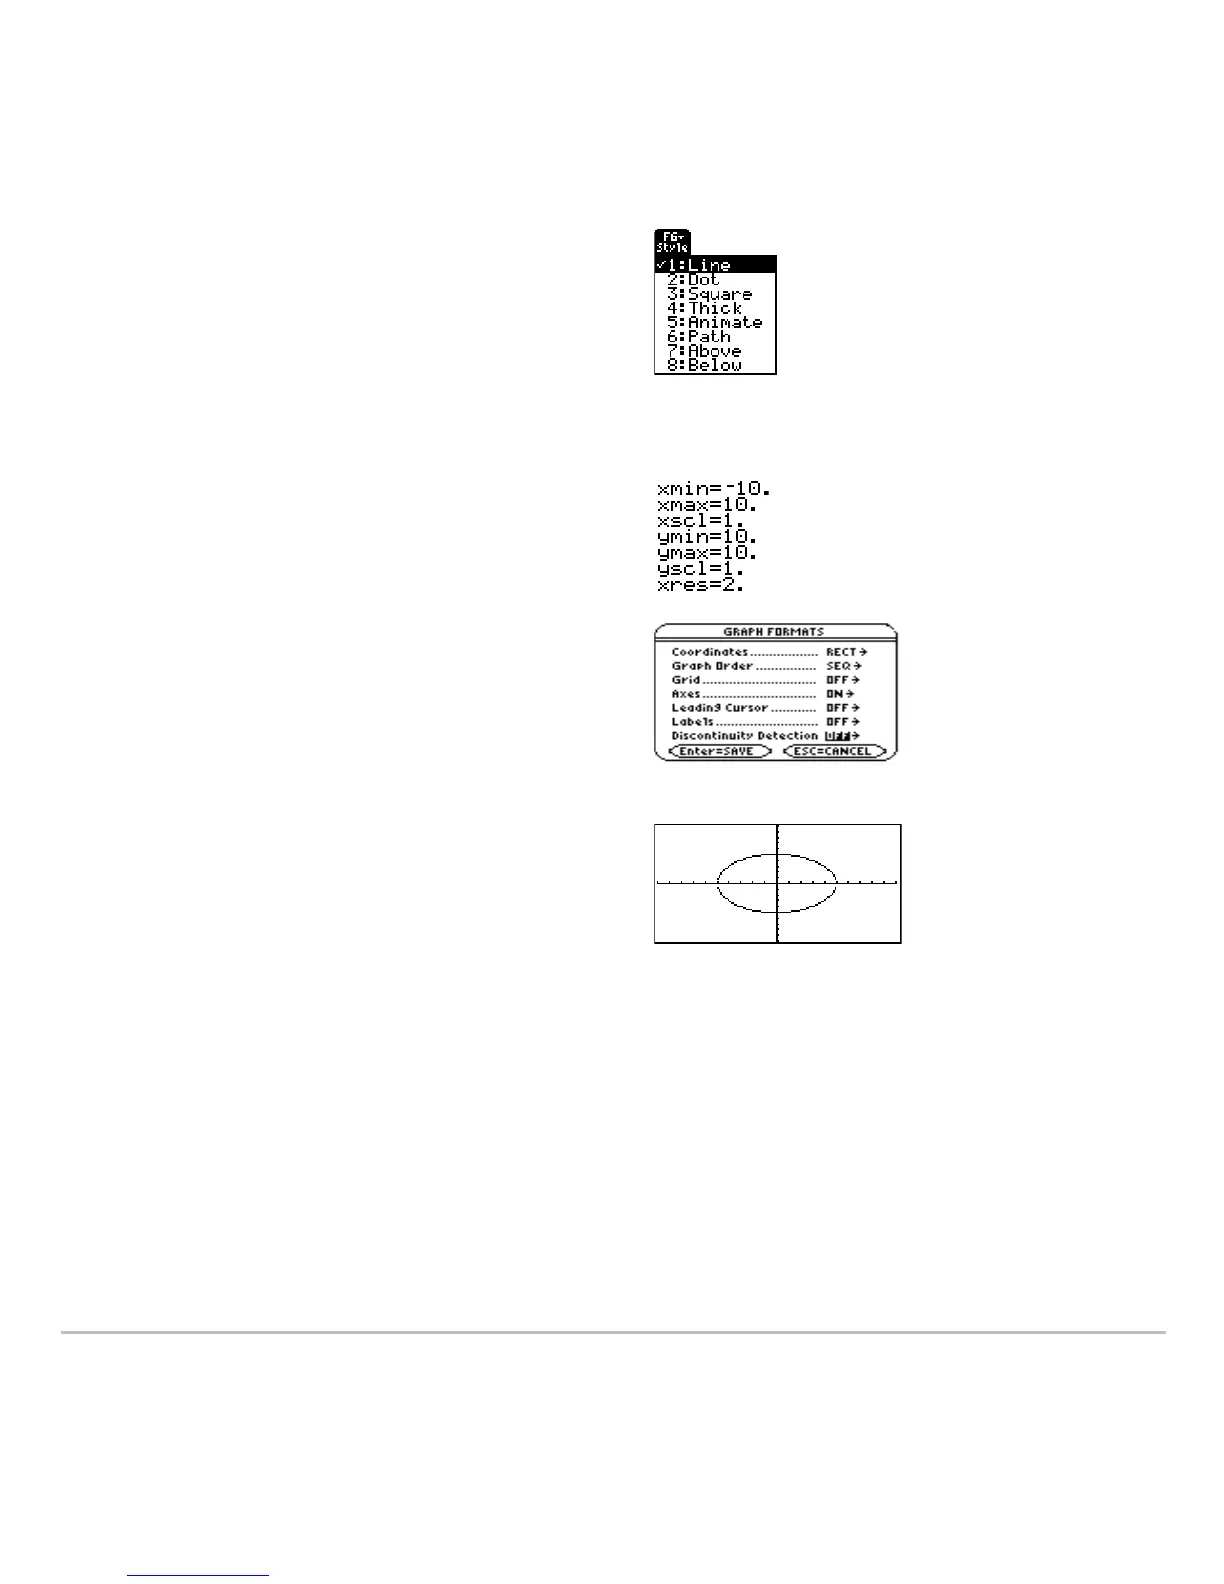
4. Set the display style for a function.
2 ˆ
This is optional. For multiple equations,
this helps visually distinguish one from
another.
5. Define the viewing window (8 $).
Zoom also changes the viewing
window.
6. Change the graph format if necessary.
ƒ
9
– or –
8 Í
7. Graph the selected functions (8%).

Table of Contents

Questions and Answers:

Question and Answer IconNeed help?

Do you have a question about the Texas Instruments Titanium TI-89 and is the answer not in the manual?

Texas Instruments Titanium TI-89 Specifications

General IconGeneral
Display TypeLCD
Display Resolution160 x 100 pixels
Memory188 KB RAM, 2.7 MB Flash ROM
TypeGraphing Calculator
DisplayMonochrome
ProcessorMotorola 68000
Processor Speed12 MHz
Power Source4 AAA batteries
ConnectivityUSB
ProgrammingTI-BASIC, Assembly
Operating SystemAMS (Advanced Mathematics Software)

Related product manuals