EasyManuals Logo

Texas Instruments Titanium TI-89 User Manual

Texas Instruments Titanium TI-89
1008 pages
To Next Page IconTo Next Page
To Previous Page IconTo Previous Page
Page #119 background imageLoading...
Page #119 background image
Previews 119
Statistics and Data Plots
Statistics and Data Plots Statistics and Data Plots
Statistics and Data Plots
Based on a sample of seven cities, enter data that relates population to the number of
buildings with more than 12 stories. Using Median-Median and linear regression
calculations, find and plot equations to fit the data. For each regression equation, predict
how many buildings of more than 12 stories you would expect in a city of 300,000
people.
Steps and keystrokes Display
1. Display the MODE dialog box. For Graph
mode, select
FUNCTION.
Press 3 B 1 ¸
2. Use•O to display the
Data/Matrix
Editor
. Create a new data variable named
BUILD.
Press 3 D D BUILD ¸ ¸
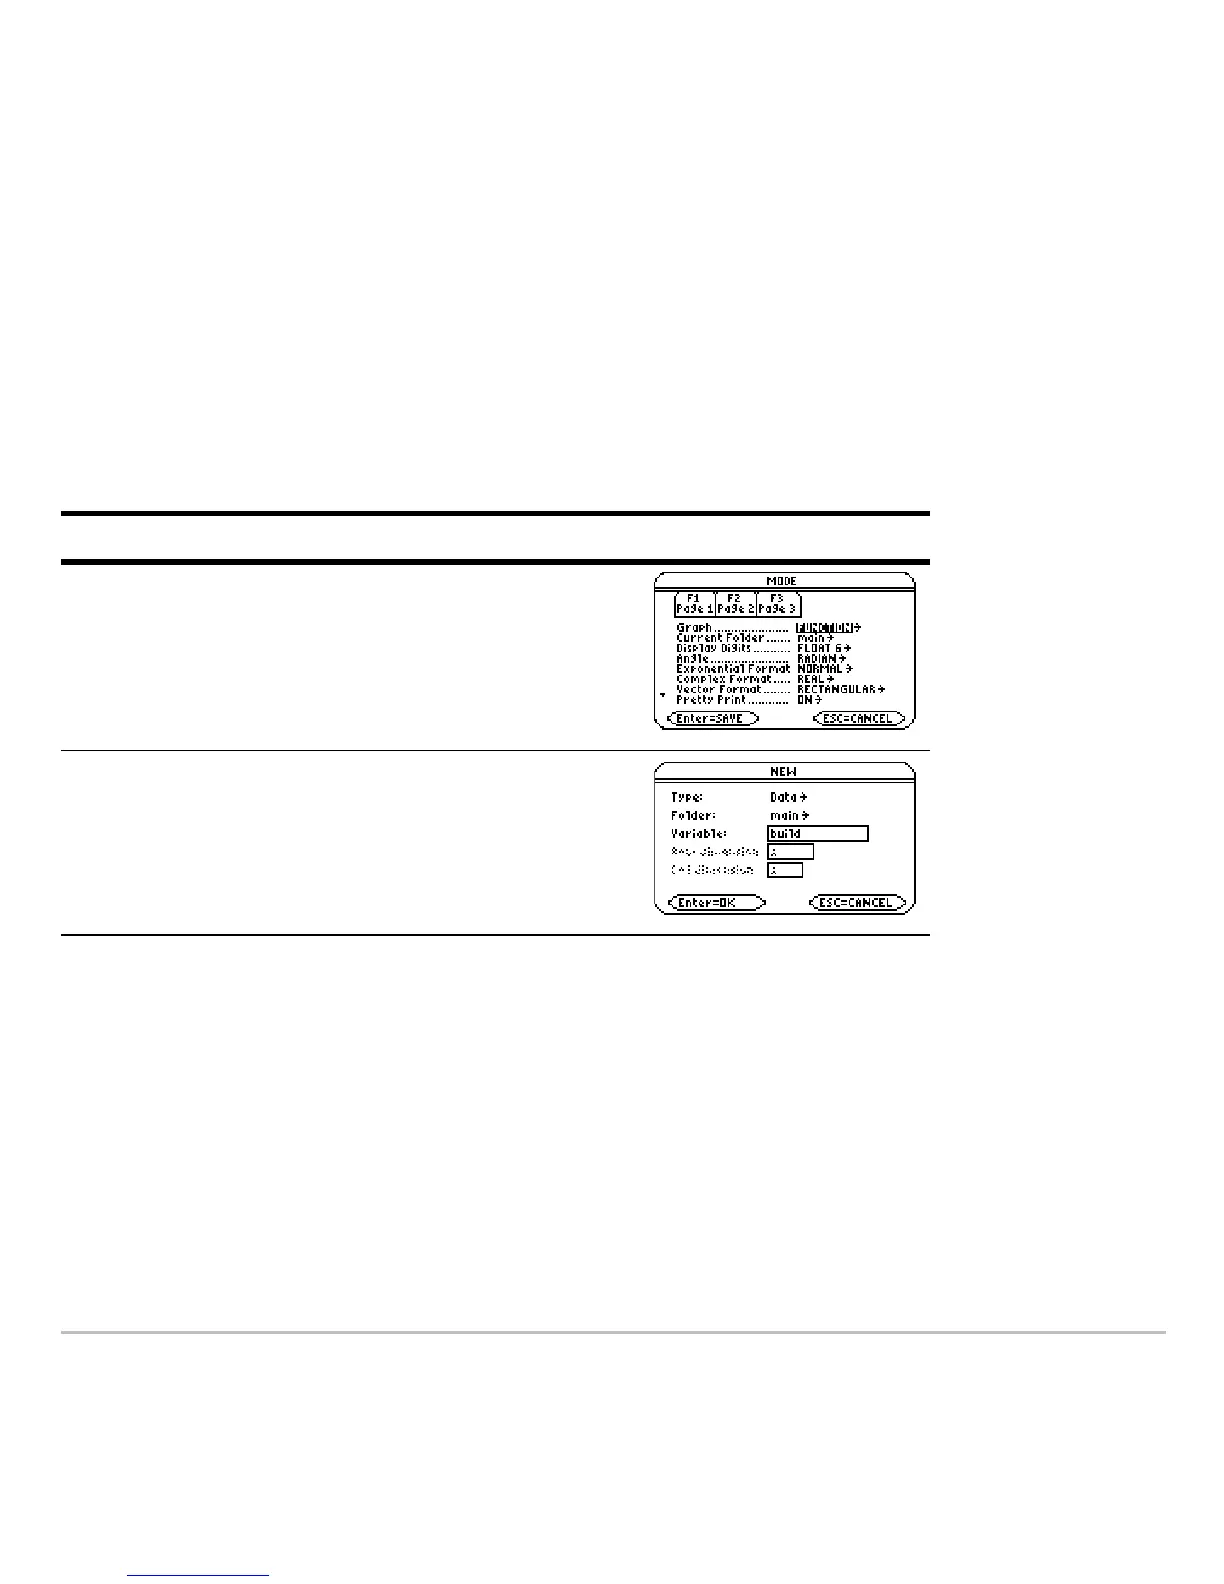
Table of Contents

Questions and Answers:

Question and Answer IconNeed help?

Do you have a question about the Texas Instruments Titanium TI-89 and is the answer not in the manual?

Texas Instruments Titanium TI-89 Specifications

General IconGeneral
Display TypeLCD
Display Resolution160 x 100 pixels
Memory188 KB RAM, 2.7 MB Flash ROM
TypeGraphing Calculator
DisplayMonochrome
ProcessorMotorola 68000
Processor Speed12 MHz
Power Source4 AAA batteries
ConnectivityUSB
ProgrammingTI-BASIC, Assembly
Operating SystemAMS (Advanced Mathematics Software)

Related product manuals