EasyManuals Logo

Texas Instruments Titanium TI-89 User Manual

Texas Instruments Titanium TI-89
1008 pages
To Next Page IconTo Next Page
To Previous Page IconTo Previous Page
Page #897 background imageLoading...
Page #897 background image
Appendix A: Functions and Instructions 897
ZoomData CATALOG
ZoomData
Adjusts the window settings based on the
currently defined plots (and data) so that all
statistical data points will be sampled, and
displays the Graph screen.
Note: Does not adjust
ymin and ymax for
histograms.
In function graphing mode:
{1,2,3,4}! L1 ¸ {1 2 3 4}
{2,3,4,5}
! L2 ¸ {2 3 4 5}
newPlot 1,1,L1,L2
¸ Done
ZoomStd
¸
"
ZoomData
¸
ZoomDec CATALOG
ZoomDec
Adjusts the viewing window so that @x and
@y = 0.1 and displays the Graph screen with the
origin centered on the screen.
In function graphing mode:
1.25xù cos(x)! y1(x) ¸ Done
ZoomStd
¸
"
ZoomDec
¸
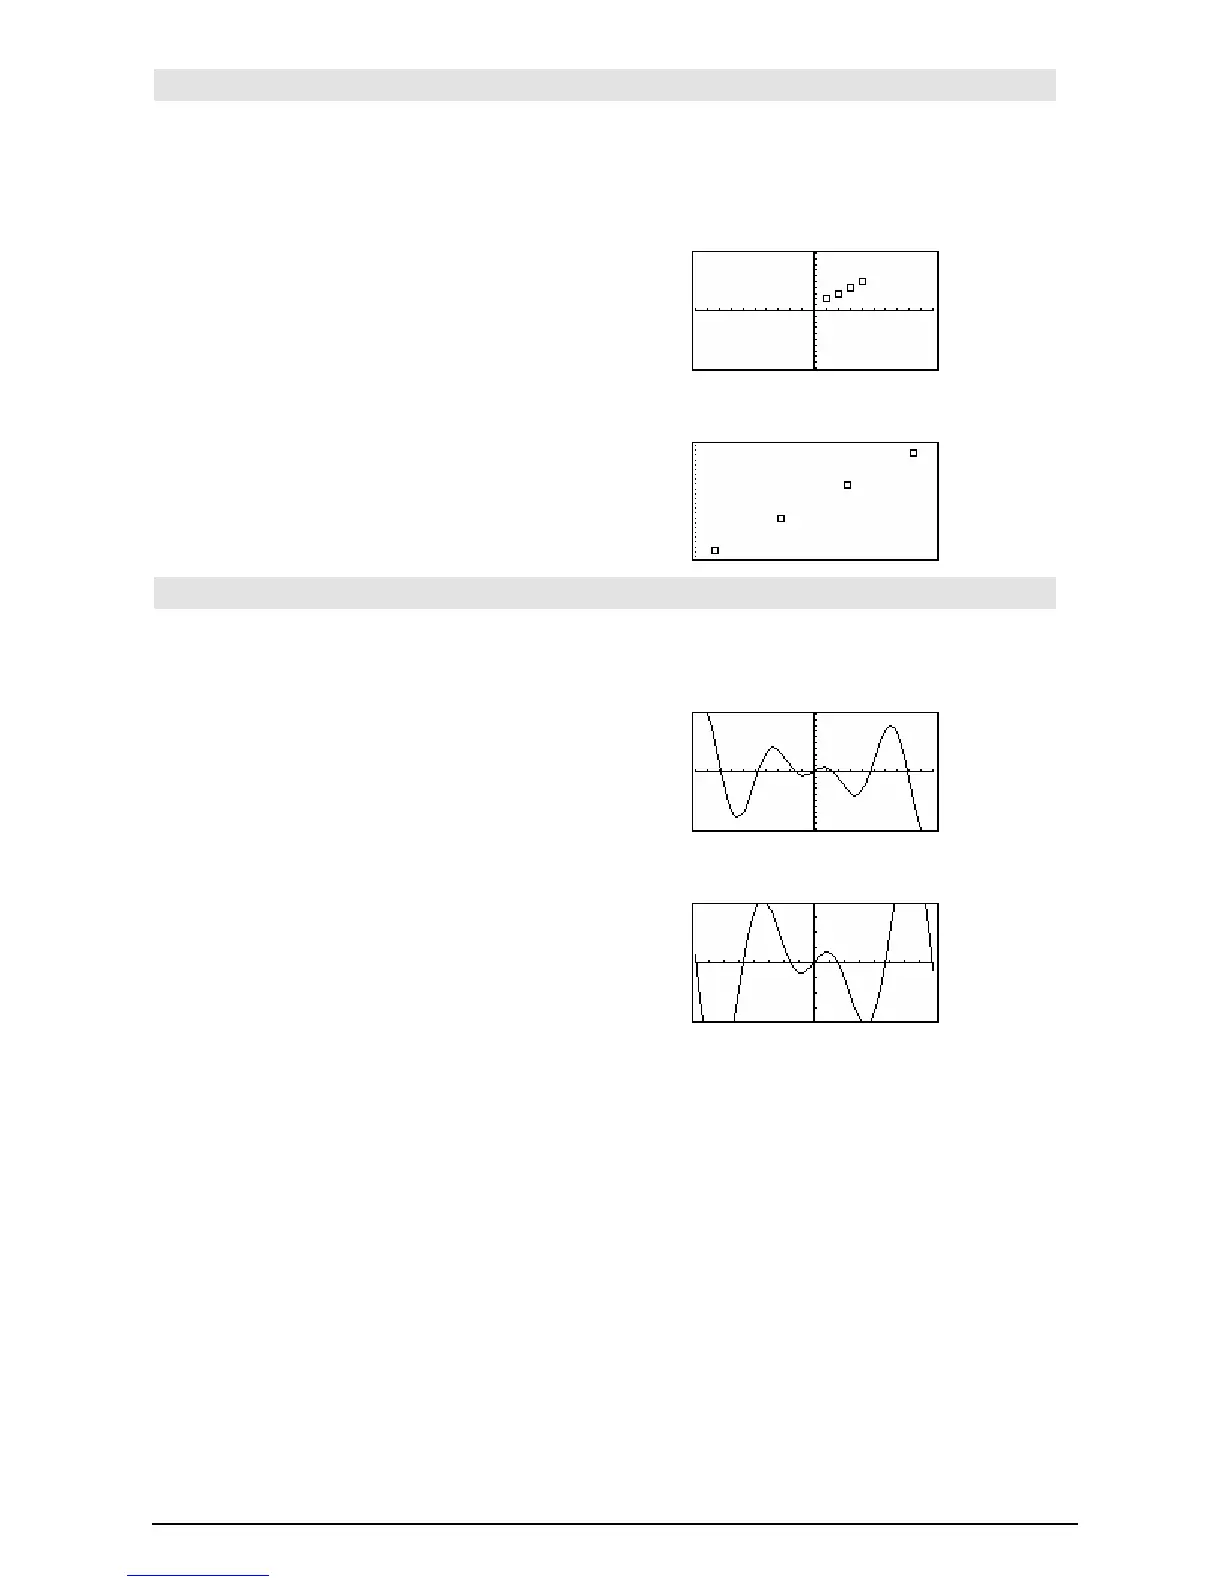
Table of Contents

Questions and Answers:

Question and Answer IconNeed help?

Do you have a question about the Texas Instruments Titanium TI-89 and is the answer not in the manual?

Texas Instruments Titanium TI-89 Specifications

General IconGeneral
Display TypeLCD
Display Resolution160 x 100 pixels
Memory188 KB RAM, 2.7 MB Flash ROM
TypeGraphing Calculator
DisplayMonochrome
ProcessorMotorola 68000
Processor Speed12 MHz
Power Source4 AAA batteries
ConnectivityUSB
ProgrammingTI-BASIC, Assembly
Operating SystemAMS (Advanced Mathematics Software)

Related product manuals