EasyManuals Logo

Texas Instruments Titanium TI-89 User Manual

Texas Instruments Titanium TI-89
1008 pages
To Next Page IconTo Next Page
To Previous Page IconTo Previous Page
Page #765 background imageLoading...
Page #765 background image
Activities 765
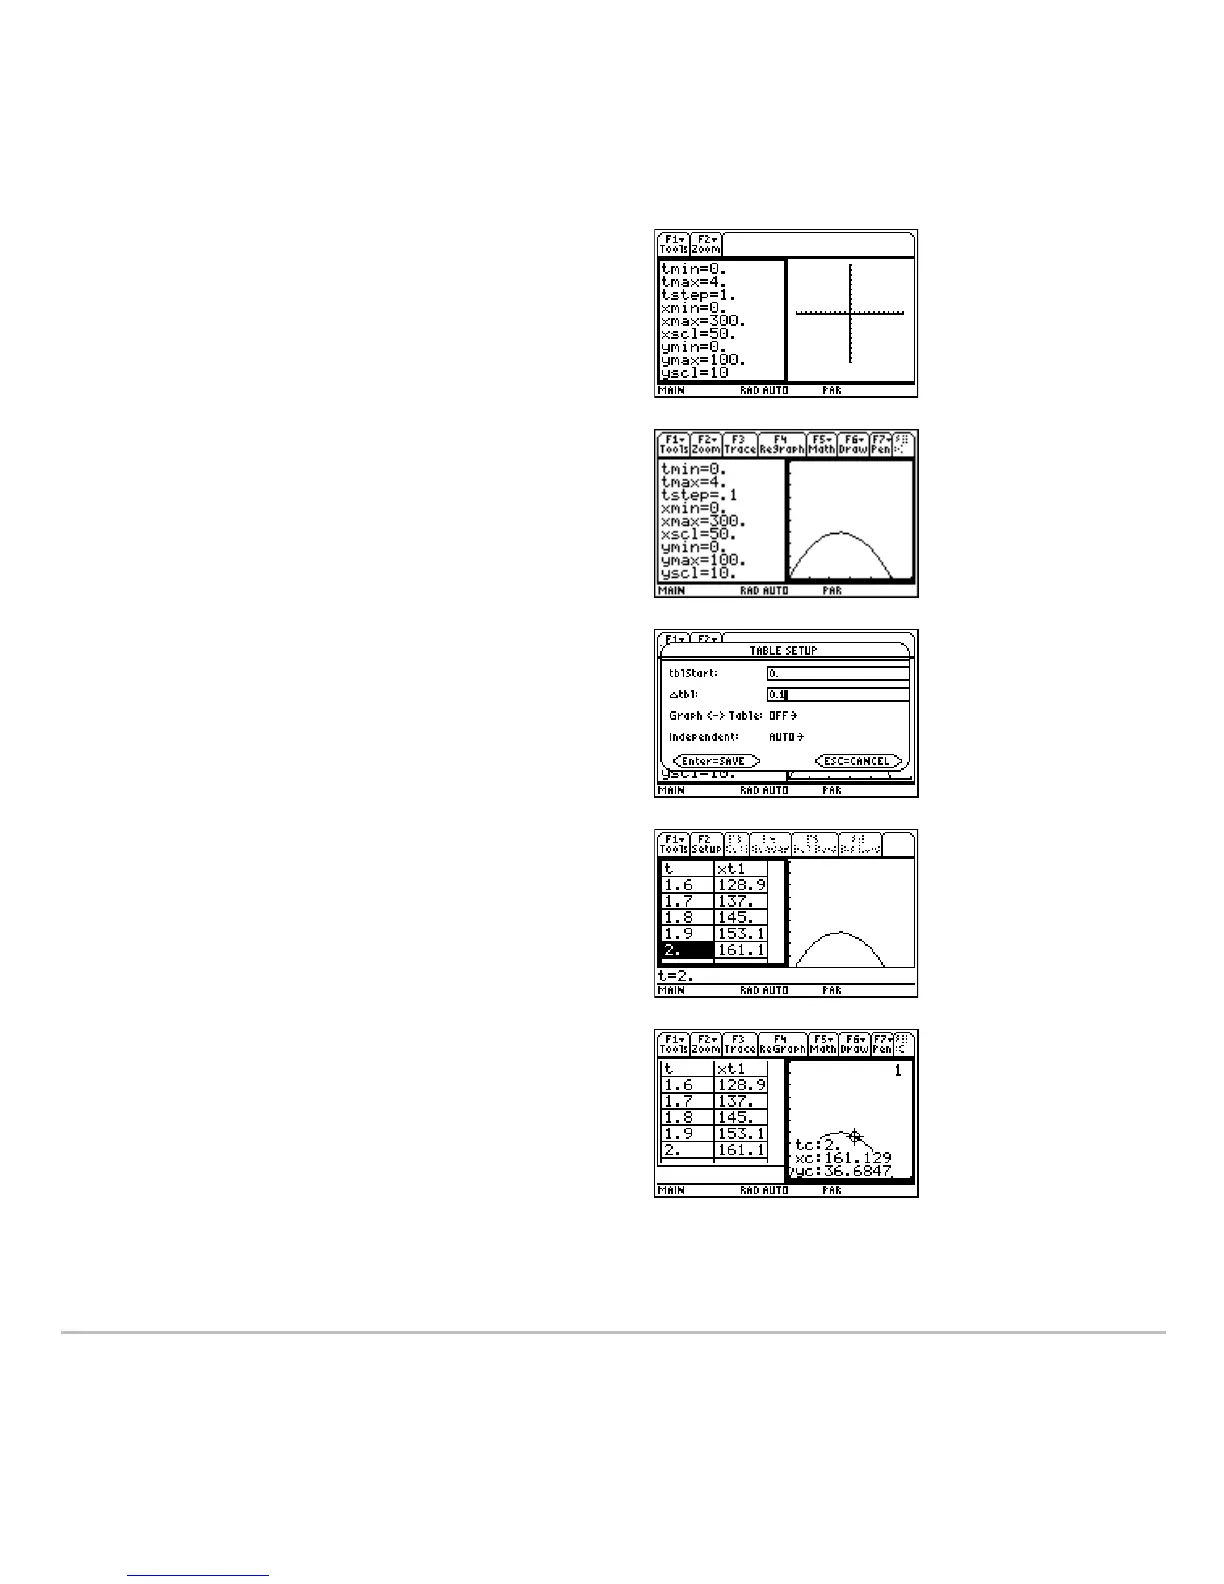
5. Set the Window variables to:
t values= [0,4,.1]
x values= [0,300,50]
y values= [0,100,10]
6. Switch to the right side and display the
graph.
Note: Press 2 a.
7. Display the
TABLE SETUP dialog box, and
change
tblStart to 0 and @tbl to 0.1.
Note: Press 8 &.
8. Display the table in the left side and press
D to highlight
t=2.
Note: Press 8 '.
9. Switch to the right side. Press , and
trace the graph to show the values of
xc
and
yc when tc=2.
Note: As you move the trace cursor from
tc=0.0 to tc=3.1, you will see the position
of the ball at time
tc.

Table of Contents

Questions and Answers:

Question and Answer IconNeed help?

Do you have a question about the Texas Instruments Titanium TI-89 and is the answer not in the manual?

Texas Instruments Titanium TI-89 Specifications

General IconGeneral
Display TypeLCD
Display Resolution160 x 100 pixels
Memory188 KB RAM, 2.7 MB Flash ROM
TypeGraphing Calculator
DisplayMonochrome
ProcessorMotorola 68000
Processor Speed12 MHz
Power Source4 AAA batteries
ConnectivityUSB
ProgrammingTI-BASIC, Assembly
Operating SystemAMS (Advanced Mathematics Software)

Related product manuals