EasyManua.ls Logo

Trango Systems TrangoLINK GigaPlus - Transmitter Minimum Power Output

Trango Systems TrangoLINK GigaPlus
255 pages
Print Icon
To Next Page IconTo Next Page
To Previous Page IconTo Previous Page
Loading...
Trango Systems, Inc. GigaPlus User Manual Rev 3.1 39
Modulation
Level
Transmitter Maximum Power Output Level (dBm)
6
GHz
7
GHz
8
GHz
10
GHz
11
GHz
13
GHz
15
GHz
18
GHz
23
GHz
26
GHz
28
GHz
32
GHz
38
GHz
256 QAM
+24
+24
+24
+21
+21
+20
+20
+19
+19
+19
+16
+16
+16
128 QAM
+25
+25
+25
+22
+22
+21
+21
+20
+20
+20
+17
+17
+17
64QAM
+25
+25
+25
+22
+22
+21
+21
+20
+20
+20
+17
+17
+17
32QAM
+28
+28
+28
+26
+26
+23
+23
+22
+22
+22
+21
+21
+21
16QAM
+28
+28
+28
+26
+26
+23
+23
+22
+22
+22
+21
+21
+21
QPSK
+30
+30
+30
+28
+28
+26
+26
+25
+25
+25
+23
+23
+23
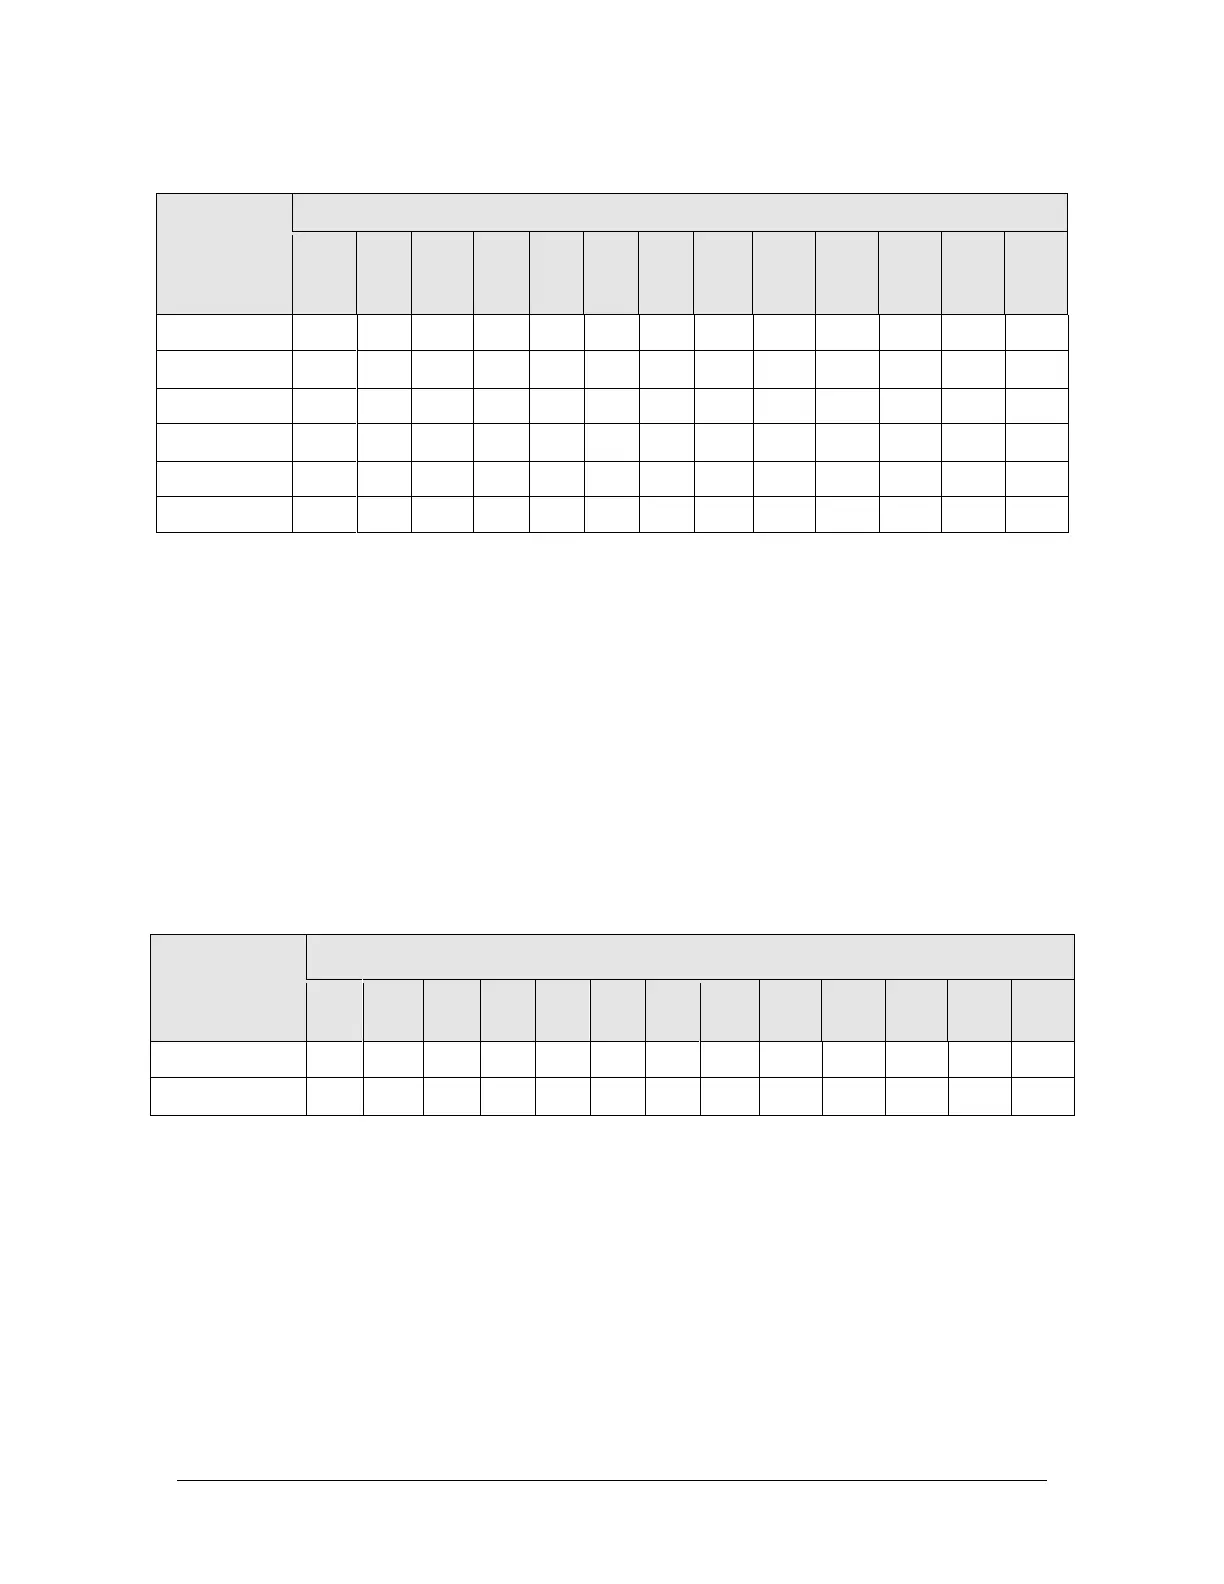
Table 7 Maximum Set Power Levels by Band and Modulation
When ATPC is active, the atpc_max power must be set to the maximum power for the
highest modulation used.
Transmitter Minimum Power output
The minimum transmit power that can set is limited by the ODU model and is not
dependent on the modulation level like the maximum levels are. The table below shows
the minimum power levels for each band and model family. The levels are also the
minimum levels that ATPC can set the output to when enabled.
HP ODU Model
Transmitter Minimum Power Output Level (dBm)
6
GHz
7
GHz
8
GHz
10
GHz
11
GHz
13
GHz
15
GHz
18
GHz
23
GHz
26
GHz
28
GHz
32
GHz
38
GHz
HP1-XX-YYYY-ZZ
+9
+9
+9
NA
+6
+3
+3
+2
+2
+2
+2
+1
+1
HP2-XX-YYYY-ZZ
+0
+0
+0
+0
+0
+0
+0
+0
+0
+0
+0
+0
+0
Table 8 Minimum TX set power by band

Table of Contents