Understanding Your Agilent ChemStation 103
Integration
4
Peak Area Measurement
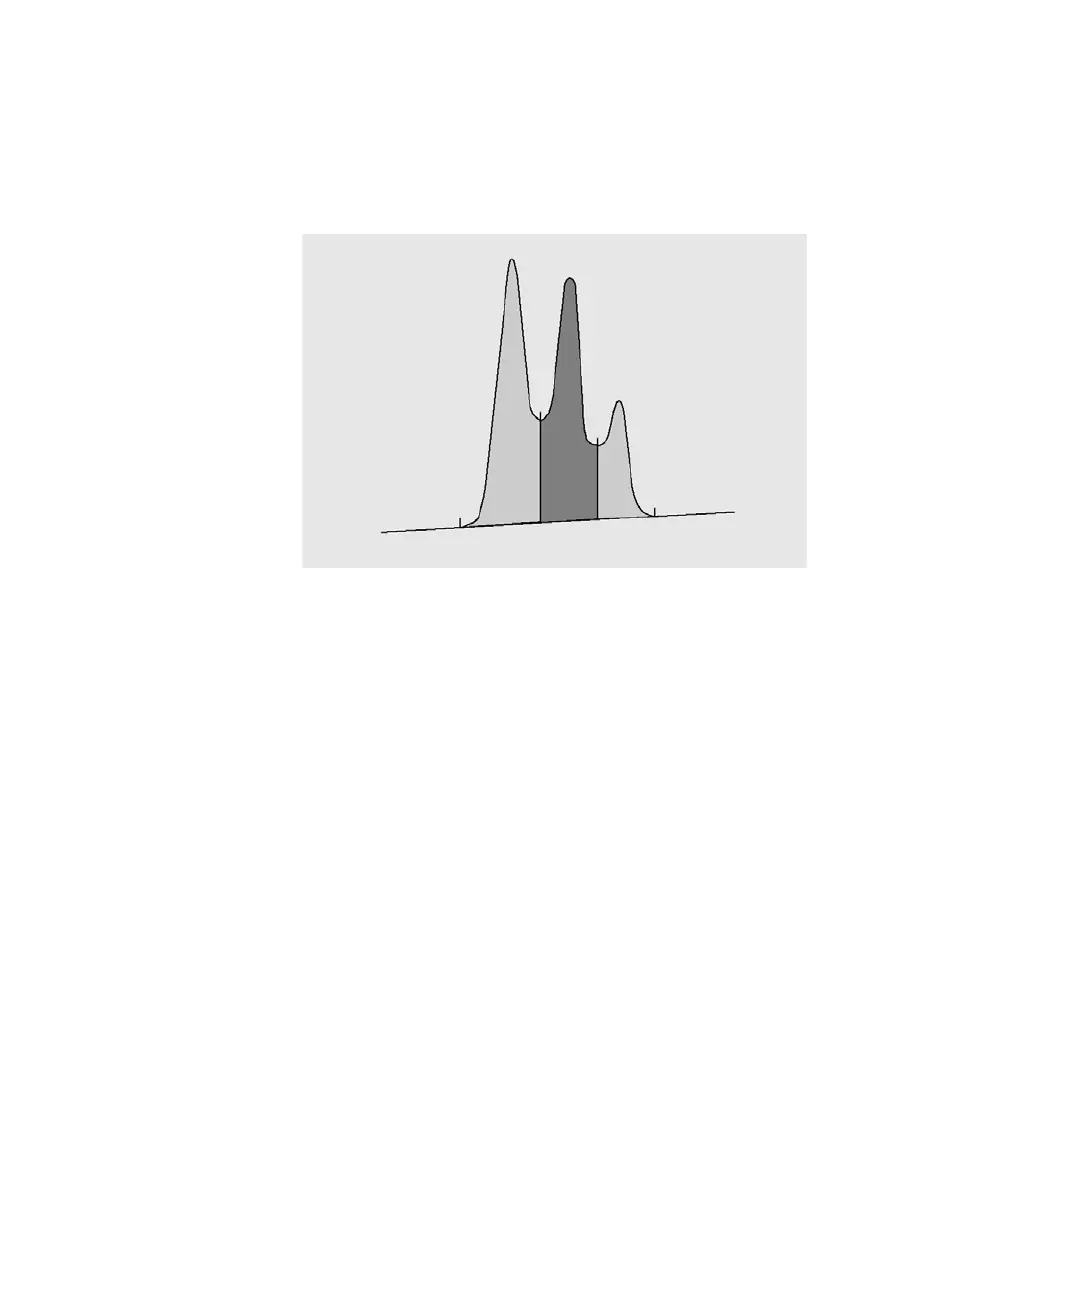
• for valley-to-valley (VV) peaks, the area above the baseline, segmented with
vertical dropped lines from tick marks, as in Figure 25 on page 103,
Figure 25 Area Measurement for Valley-to-Valley Peaks
• for tangent (T) peaks, the area above the reset baseline,
• for solvent (S) peaks, the area above the horizontal extension from the
last-found baseline point and below the reset baseline given to tangent (T)
peaks. A solvent peak may rise too slowly to be recognized, or there may be
a group of peaks well into the run which you feel should be treated as a
solvent with a set of riders. This usually involves a merged group of peaks
where the first one is far larger than the rest. The simple drop-line
treatment would exaggerate the later peaks because they are actually sitting
on the tail of the first one. By forcing the first peak to be recognized as a
solvent, the rest of the group is skimmed off the tail,
• negative peaks that occur below the baseline have a positive area, as shown
in Figure 26 on page 104.
KK

 Loading...