236 Understanding Your Agilent ChemStation
11 Evaluating System Suitability
Noise Determination
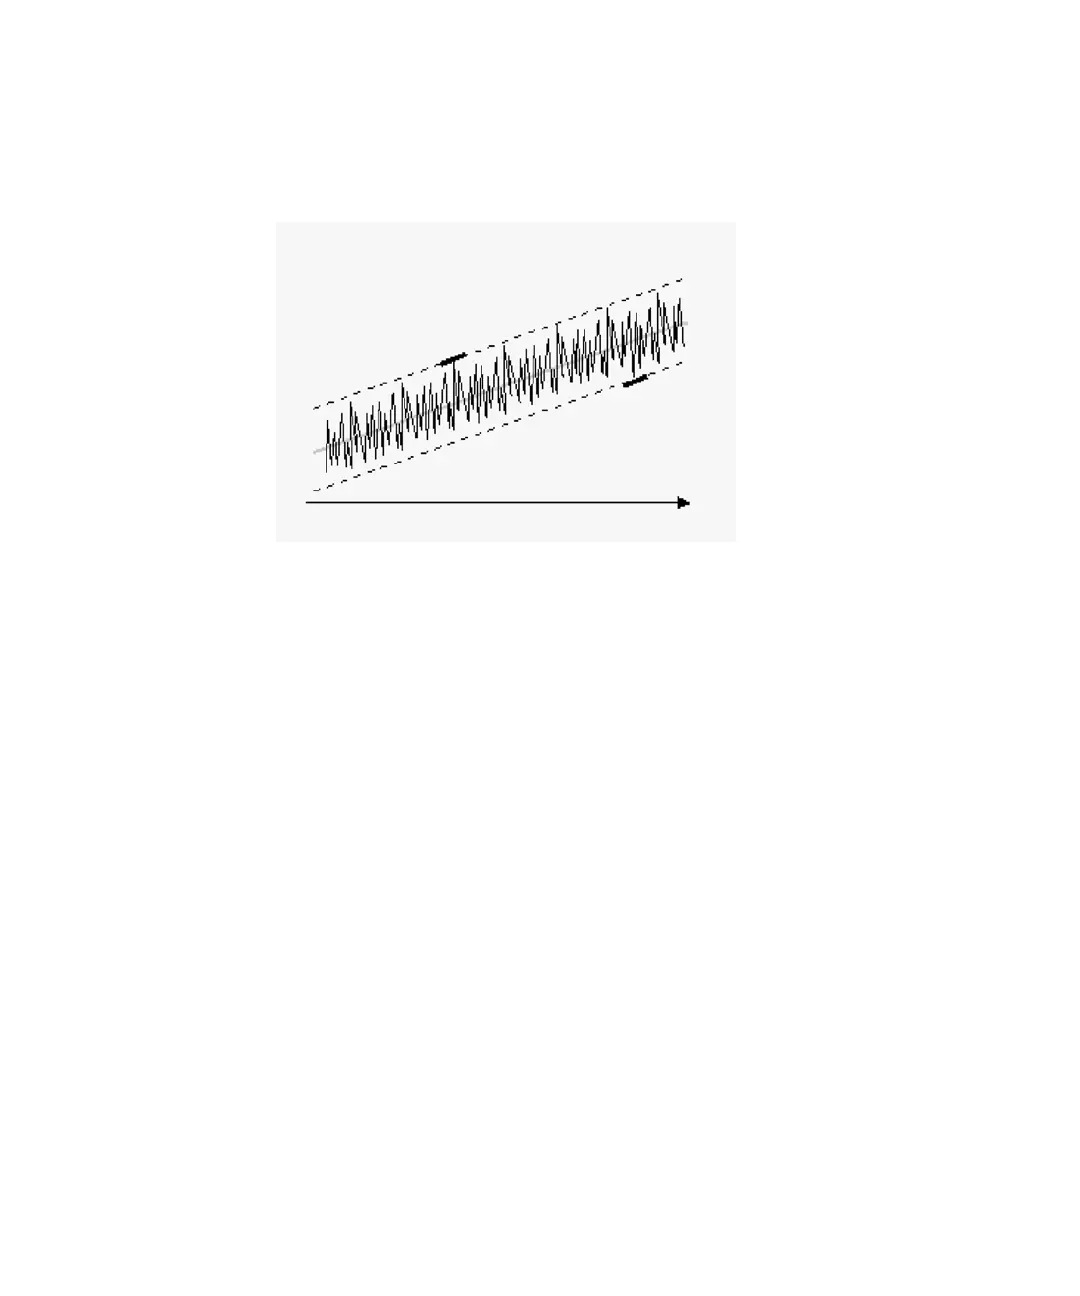
Noise Calculation Using the Peak-to-Peak Formula
Figure 43 Noise as Maximum Peak to Minimum Peak (Distance)
The drift is first calculated by determining the linear regression using all the
data points in the time range (see “Regression Analysis” on page 253). The
linear regression line is subtracted from all data points within the time range
to give the drift-corrected signal. The peak-to-peak noise is then calculated
using the formula:
N = I
max
- I
min
where
N is the peak-to-peak noise,
I
max
is the highest (maximum) intensity peak and
I
min
is the lowest (minimum) intensity peak in the time range.
i^bZ
{
cd^hZ2
bVm#eZV`
b^cjhb^c#
eZV`

 Loading...