144 Understanding Your Agilent ChemStation
7 Calibration
Calibration Curve
Calibration Curve
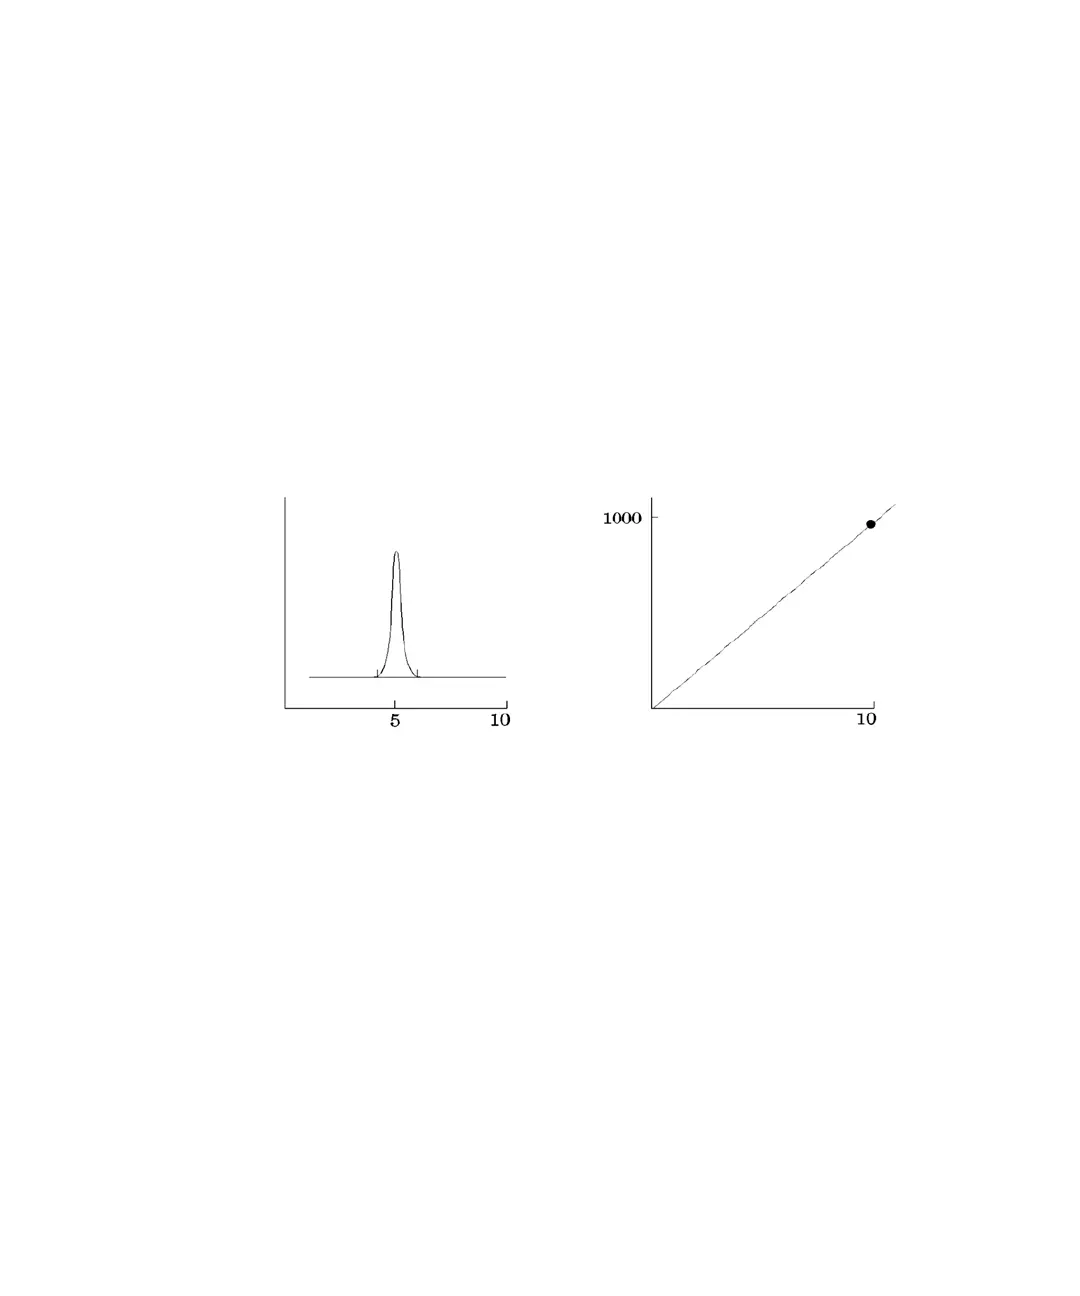
A calibration curve is a graphical presentation of the amount and response
data for one compound obtained from one or more calibration samples.
Normally an aliquot of the calibration sample is injected, a signal is obtained,
and the response is determined by calculating the area or height of the peak,
similar to Figure 32 on page 144.
Figure 32 Calibration Sample (10 ng/µl) Signal and Calibration Curve
A correlation coefficient is displayed with the graphic of the calibration
curve. The correlation coefficient is the square root of the regression
coefficient and gives a measure of the fit of the calibration curve between the
data points. The value of the coefficient is given to three decimal places, in the
range:
0.000 to 1.000
where:
0.000 = no fit
1.000 = perfect fit
For each calibration level the relative residual is displayed. It is calculated
using the following formula:
GZhedchZ
I^bZb^c
GZhedchZ
6bdjcic\$¥a

 Loading...