Understanding Your Agilent ChemStation 149
Calibration
7
Types of Calibration
assumed to be linear. The difference between the two calibration types is that,
with linear fit, the slope of the detector response can be determined by a best
fit through a number of points, one for each level.
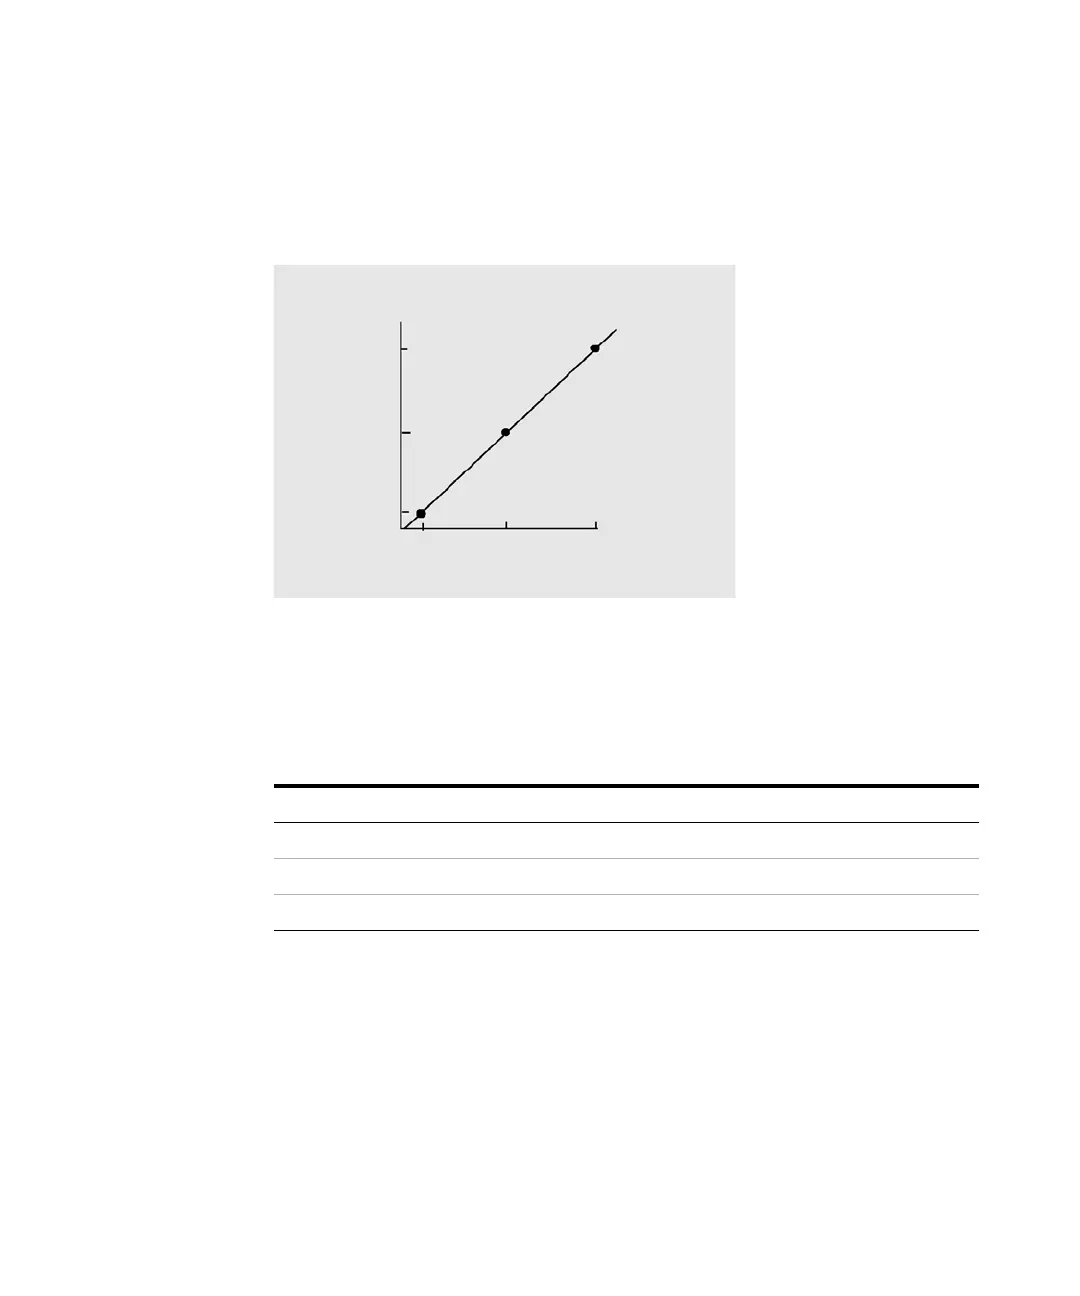
Figure 36 Multi-level calibration curve with three levels
The corresponding calibration table, which is the tabulation of the
information used to generate this curve, might look similar to the one shown
in Table 14 on page 149.
In this example, the calibration samples that were used to generate the three
levels had been identified as 1, 2 and 3.
Table 1 4 Calibration Table
Level Amount (ng/µl) Response (area counts)
11 100
25 500
310 1000
&%
8dcXZcigVi^dcPc\$¥aR
GZhedchZ
&%%%
8Va^WgVi^dc8jgkZ
&%%
&
*
*%%

 Loading...