4.5 Analyzing Waveform
4-19
4
Changing Measurement Conditions
The center wavelength (λc) and standard deviation (σ) are calculated by
the following formula.
AnAA
nAnAA
Ai
iAi
c
n
i
n
i
+++
+++
==
∑
∑
=
=
......21
.....2211
1
1
λλλ
λ
λ
∑
∑
=
=
−×
=
n
i
n
i
Ai
ciAi
1
1
2
)}({
λλ
σ
Ai: Level of i-th peak point of spectrum exceeding the level
lowered slice level from peak level. The setting unit is W.
λi: Wavelength of i-th peak point of spectrum exceeding the
level lowered slice level from peak level
n: Peak level count
The wavelength marker is displayed at the spectrum width.
Level Marker C indicates the spectrum peak level and Level Marker D
indicates the half value of the peak level.
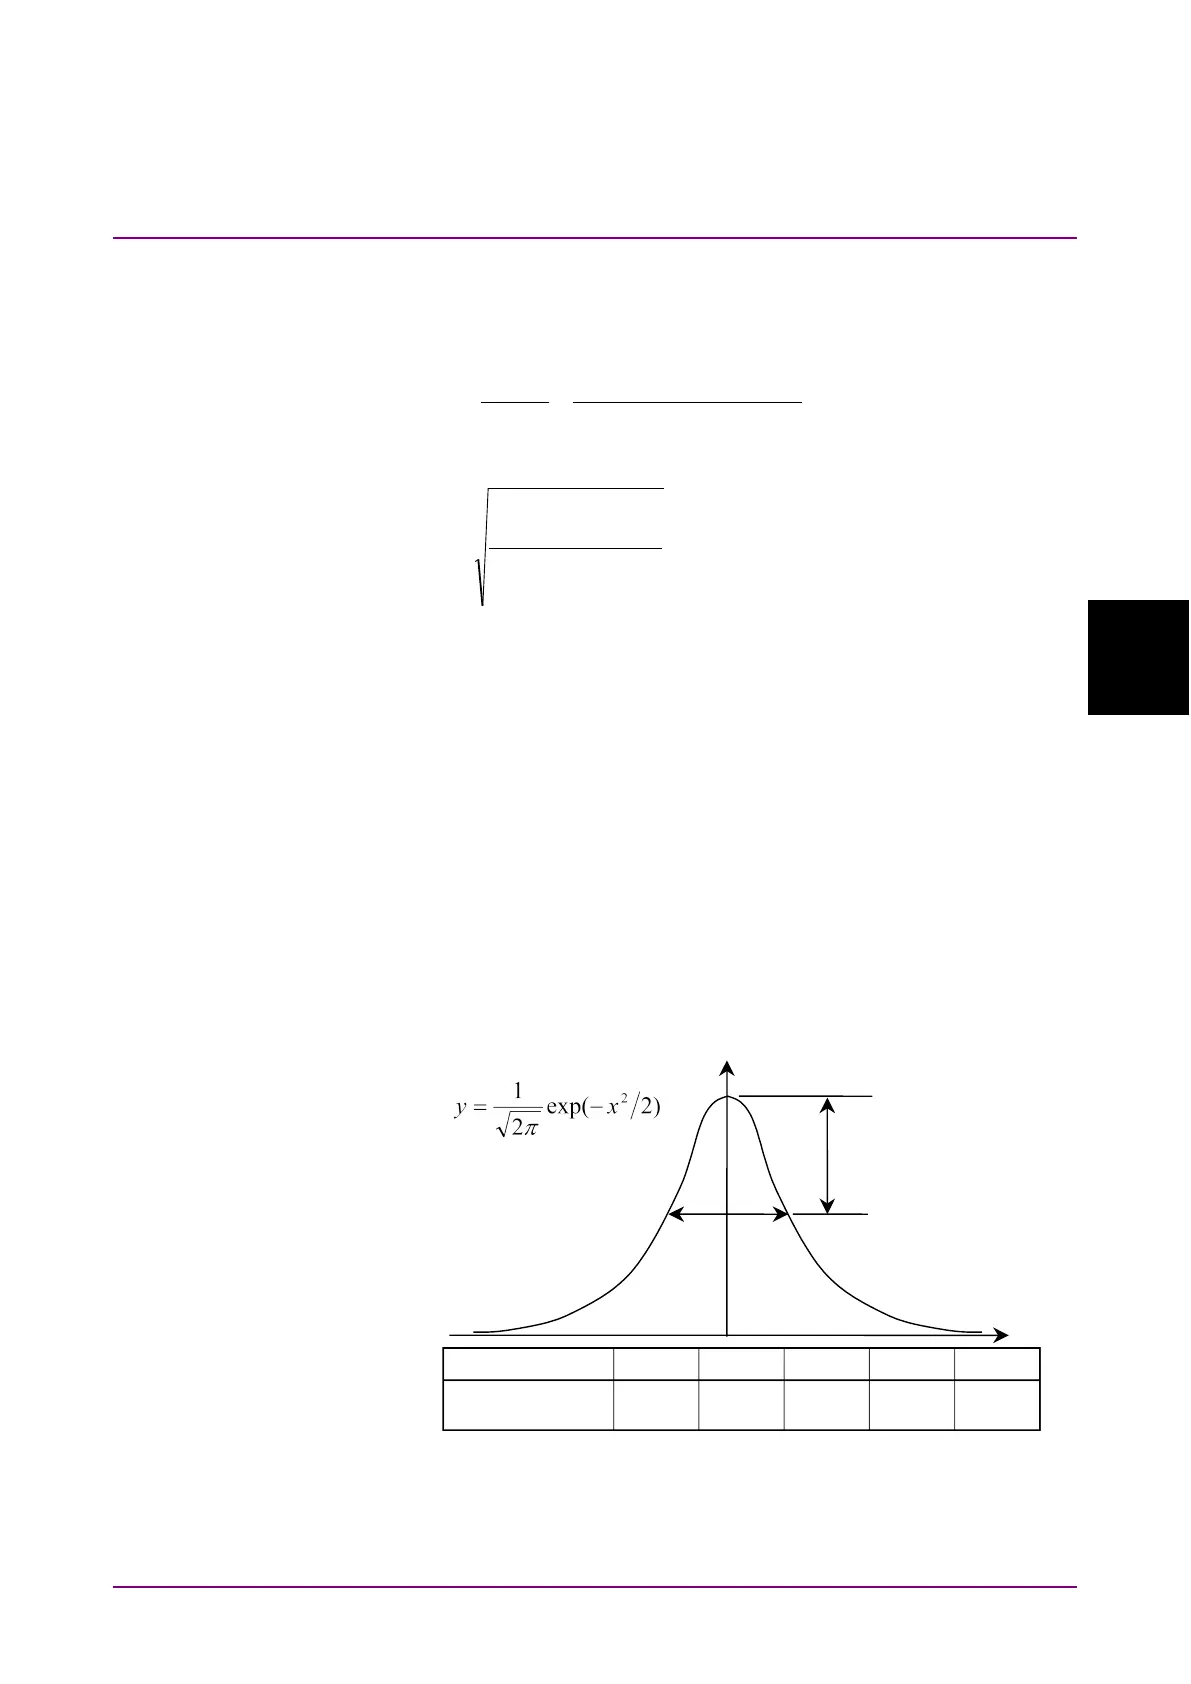
The relationship between the multiplier k and level difference of the
Gaussian distribution function is shown in the following diagram.
Figure 4.5.5-2 Multiplier k and Gaussian Distribution Function Level
Difference
x
0.54 2.17 3.00 4.89 20.0