Chapter 1 Outline
1-2
1.1 Introduction of Optical Spectrum Analyzer
1.1.1 Description of Optical Spectrum Analyzer
The MS9740B Optical Spectrum Analyzer (hereafter, MS9740B)
measures the power distribution (spectrum) of optical wavelengths.
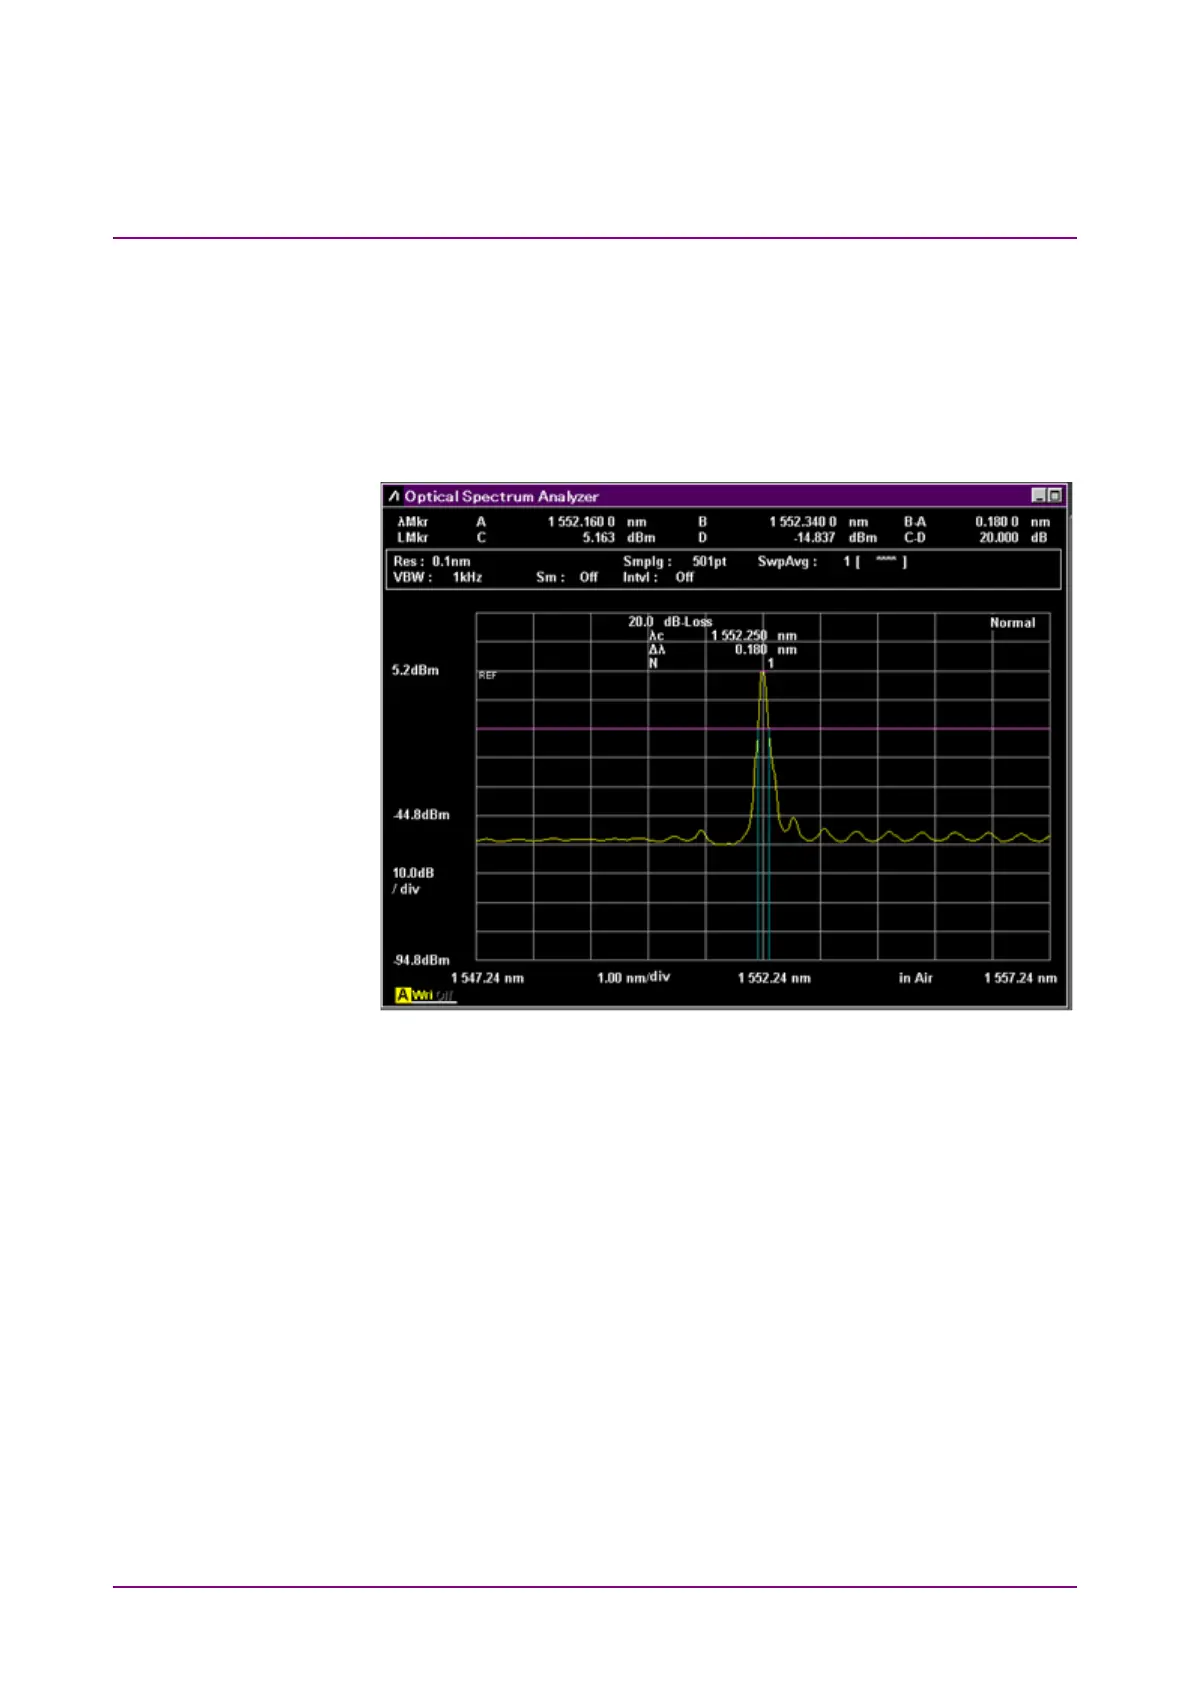
Figure 1.1.1-1 shows a measurement example.
Figure 1.1.1-1 Measurement Example of Optical Spectrum Analyzer
The horizontal axis indicates the wavelength o n l y. The marker position
and analysis result indicate the wavelength or frequency.
The vertical axis indicates the power or relative values. The relative value
is the ratio assuming that the measurement value with the maximum
power is 100%. The scale can be changed to linear or logarithm.