5.7 Measuring Optical Amplifier
5-49
5
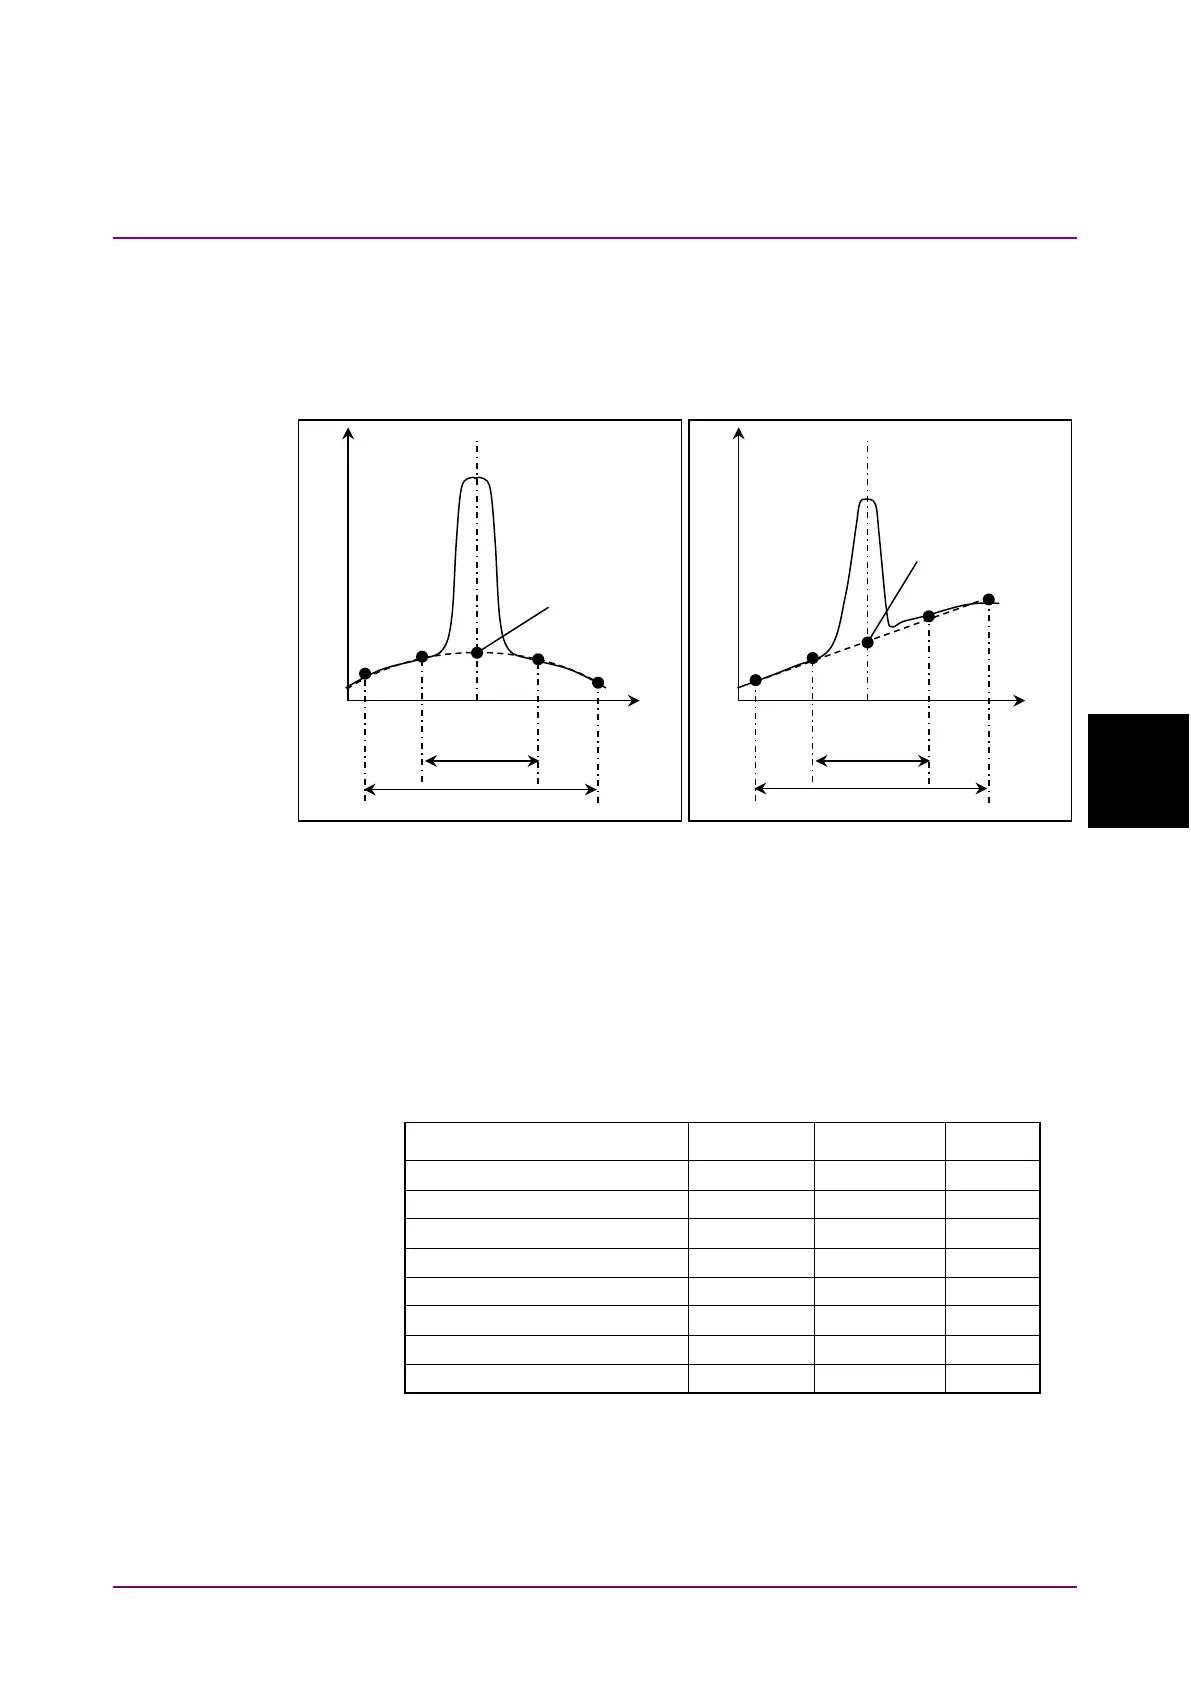
Mean Fitting:
Fitting Method Utilizing a Linear Function
The mean of the data for λ2 and λ3 in Figure 5.7.1-2 (b) is found (mW
units). The product of this value and optical band filter correction value
is Pase.
Figure 5.7.1-2 Finding Pase
The input range and the data set with the optical amplifier measurement
are as follows.
This data is input in the Parameter dialog box.
Table 5.7.1-1 Setting Range of the Parameters in the Parameter Dialog
Box
Item Min. Max. Unit
1
*1: The Fitting Span is set within the following range so as to fit within
the screen’s wavelength range.
Signal Wl + Fitting Span/2 = < Stop
Signal Wl – Fitting Span/2 > = Start
Fitting Span
Fitting Span