System Options: MEMS – Heating Stage
C O N F I D E N T I A L – FEI Limited Rights Data7-26
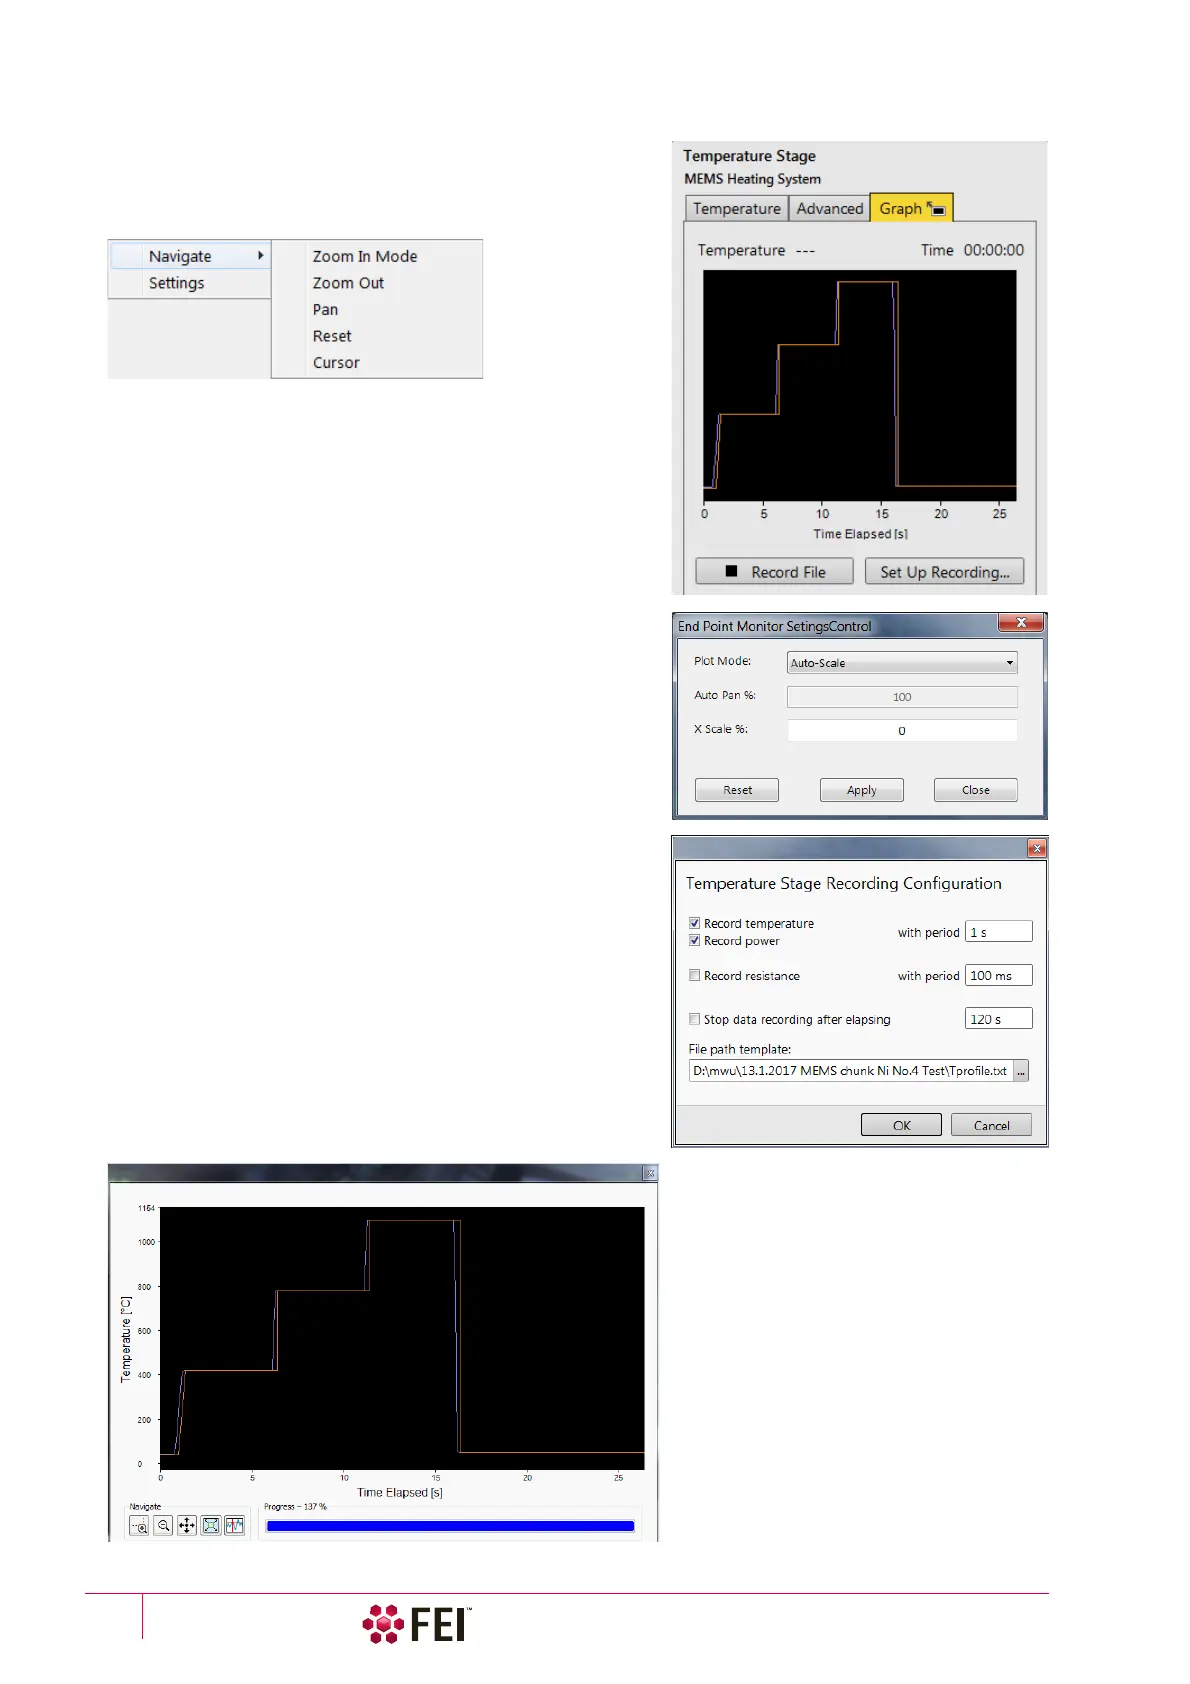
Graph tab
The dependence (graph) of the Tem perature / Power / Resistance
on the Time Elapsed is drawn here.
The right-clicking above the graph area shows the menu to select
visualization parameters (Navigate):
• Zoom In Mode / Zoom Out – graph measuring scale,
• Pan – scrolling around the enlarged graph,
• Reset – brings Zoom and Pan settings to default values,
• Cursor – enables to browse to and to explore graph points
and graph Settings:
• Initially the graph Plot Mode is Auto-Scale, meaning that the
minimum and maximum of both axes are computed
automatically so that the graph is completely visible. As points
are added the graph may rescale to achieve this.
• Dragging a rectangle in the graph when in Zoom In Mode
zooms in that rectangle and the graph switches to a Plot Mode
/ Auto-Pan. In this mode the graph is automatically moved
forward according to an Auto Pan % value.
• The X Scale % value keeps a graph scale in a fixed level.
• Clicking the Record File button saves actual graph data to the
CSV file.
• Clicking the Set Up Recording button opens the dialogue with
selections of desired data and parameters to be recorded.
Clicking the black rectangle with an arrow in the Graph header
shows the large graph window. Icons at the left bottom corner
corresponds to the Navigate menu (see above).