TX140 S2
Upgrade and Maintenance Manual 325
Appendix
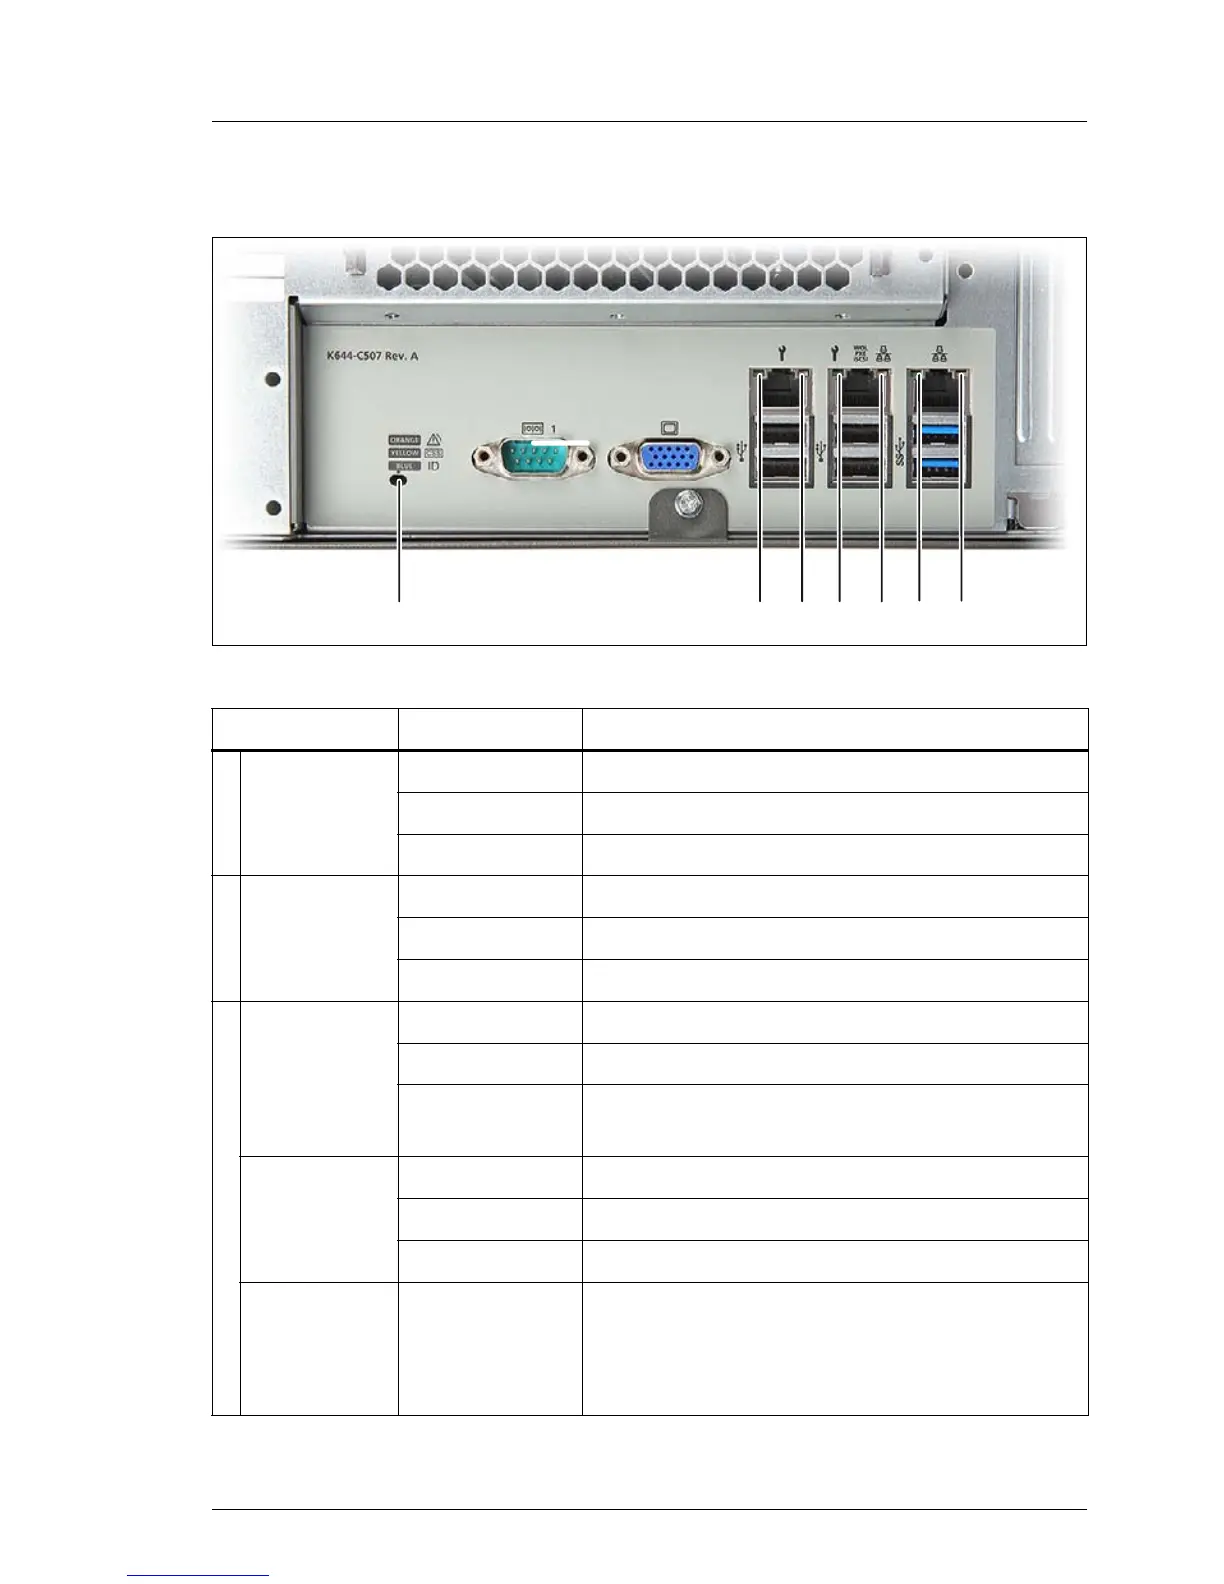
17.2.1.4 I/O panel indicators
Figure 227: I/O panel indicators
Indicator Status Description
1
LAN
link/transfer
green on LAN connection established
off no LAN connection
green flashing data transfer in progress
2 LAN speed
yellow on traffic a transfer rate of 1 Gbit/s
green on traffic a transfer rate of 100 Mbit/s
off traffic a transfer rate of 10 Mbit/s
3
Global error
indicator
off no critical event (non CSS component)
orange on prefailure detected (non CSS component)
orange
flashing
non CSS component failure
CSS
indicator
off no critical event (CSS component)
yellow on prefailure detected (CSS component)
yellow flashing CSS component failure
ID indicator blue on
server has been highlighted using
ServerView Operations Manager, iRMC web
frontend, or the ID button on the front panel
for easy identification
햴
햲 햳
햲 햳 햲 햳
 Loading...