Procedures for Testing with the DX Host
92 Baker DX 71-030 User Guide EN V10 www.megger.com
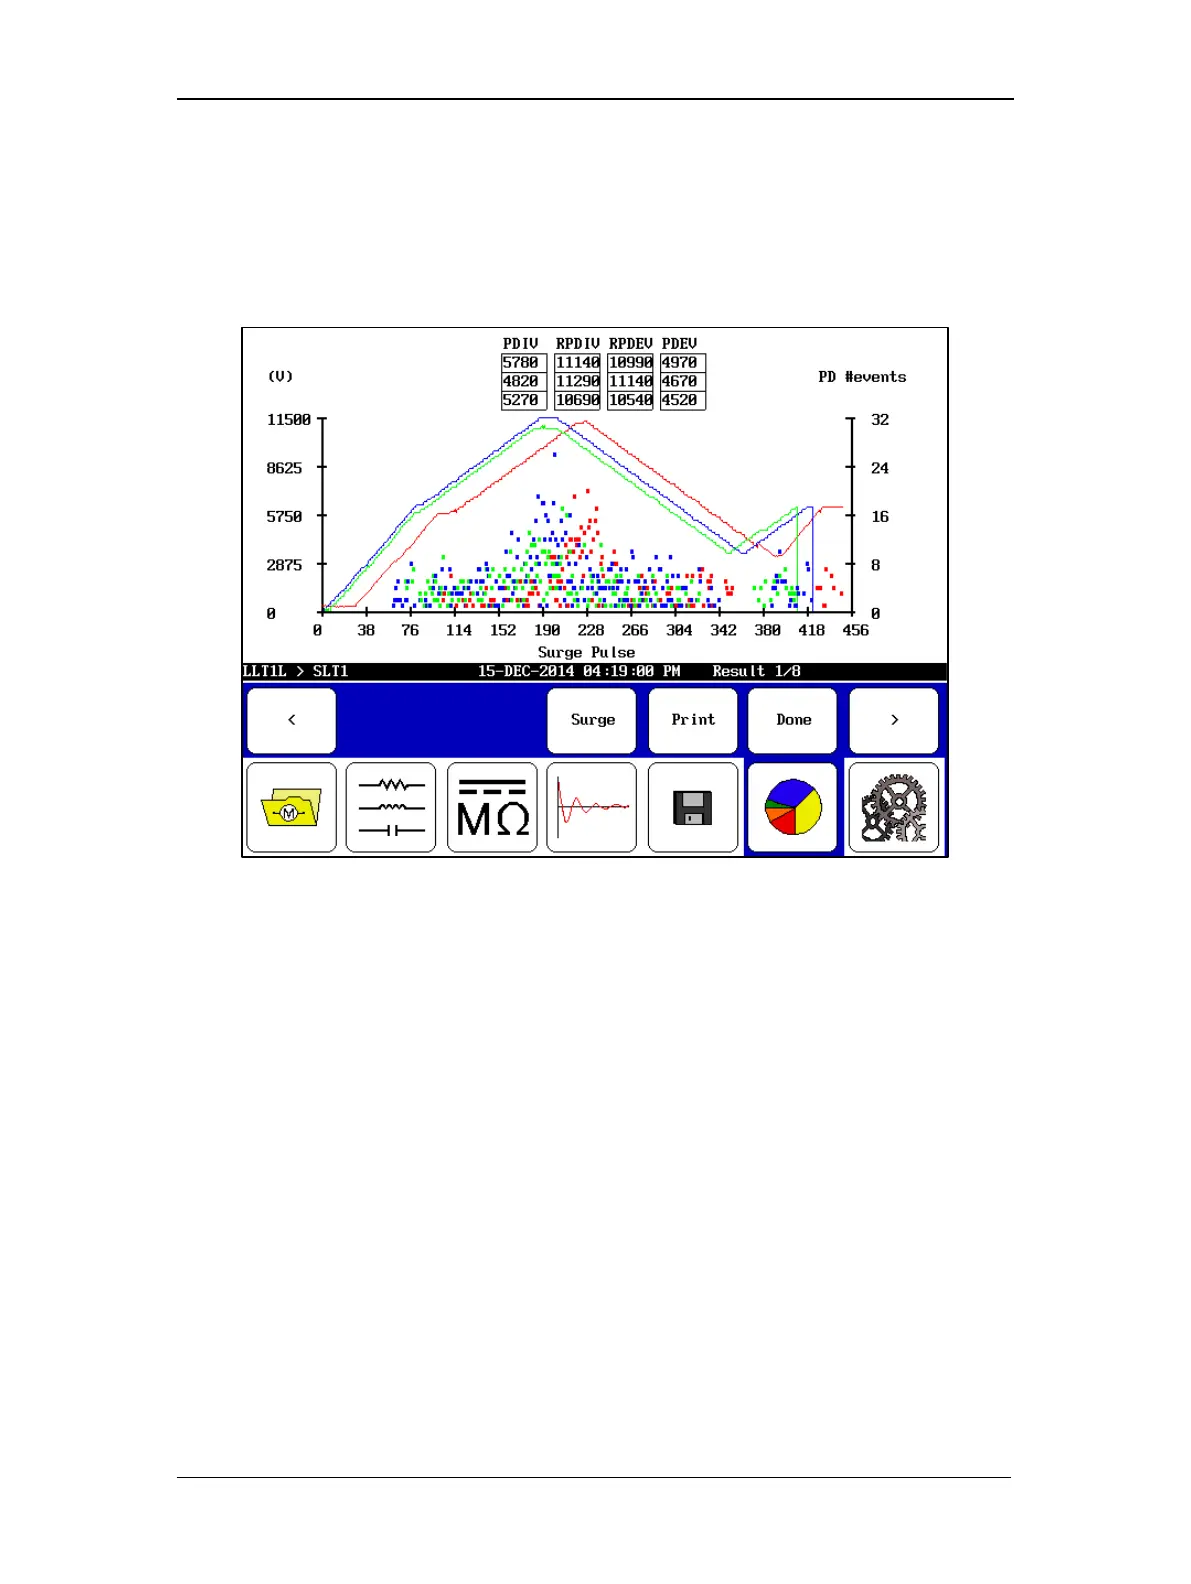
Tapping the display will switch to a house plot view where the three phases are displayed with
their respective PD activity for each surge pulse that occurred during testing.
The x axis corresponds to the individual surge pulses, and its width is determined by the test
phase with the most pulses. If the duration of tests for each phase is uneven, the shorter phases
will not extend across the entire graph. For this reason, you should attempt to keep the duration
of each test approximately the same length.
Figure 101. PD three-phase house plot report view.
The left axis shows the voltage of the surge pulse. The waveforms are indicated by solid colored
lines for each phase.
The right axis shows the number of PD events recorded for each pulse. In this view, you can see
how the PD activity rises and falls with the surge voltage.